
India has officially become one of the most unequal large economies on earth. The World Inequality Report 2026, released Wednesday by the World Inequality Lab
(co-directed by Thomas Piketty, Lucas Chancel and 100+ researchers), reveals that in 2025:
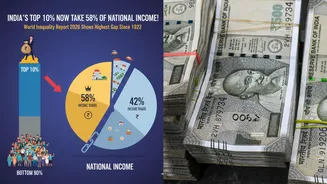
- The richest 10% of Indians capture 58% of total national income (up from 57% in 2021)
- The top 1% alone pocket 22.6% – the highest since the British Raj ended
- The bottom 50% (70 crore people) get just 15% of national income (down from 16% in 2021)
- Wealth inequality is even starker: Top 10% own 65% of total household wealth; top 1% own 40.1%
These numbers place India ahead of Brazil, South Africa and the United States in income inequality, and second only to South Africa in wealth concentration, said a report by The Indian Express.
Country Comparison :
- India: Top 10% Income Share 58% • Top 1% Income Share 22.6% • Bottom 50% Income Share 15%
- South Africa: Top 10% 66% • Top 1% 20% • Bottom 50% 10%
- Brazil: Top 10% 59% • Top 1% 28% • Bottom 50% 12%
- United States: Top 10% 47% • Top 1% 20% • Bottom 50% 13%
- China: Top 10% 41% • Top 1% 15% • Bottom 50% 18%
- France: Top 10% 33% • Top 1% 12% • Bottom 50% 22%
Source: World Inequality Lab 2026
The India Story in One Chart
In 1922 (peak of British colonial rule), the top 10% took 55–57% of income.
In 1982 (post-Independence Nehruvian era), it had fallen to ~35%.
In 2025, it is back to colonial-era levels – and still rising.
Gender, Region and Caste: Triple Layers of Inequality
- Female labour-income share: only 18% nationally (MENA region-level low)
- Rural bottom 50%: average income ₹32,000/year
- Urban top 1%: average income ₹53 lakh/year
- Scheduled Tribes & Scheduled Castes remain overwhelmingly in the bottom 40% of the distribution
Global Context: The Super-Rich Are Pulling Away Faster
- Top 0.001% (just 56,000 adults worldwide) own 6% of global wealth – more than the entire bottom 50% of humanity (4 billion people)
- One person in the global top 1-in-100-million club (56 individuals) has average wealth of €53 billion – more than the GDP of most African nations
What Changed Between 2022 and 2026 Reports?
Metric – 2021 (WIR 2022) – 2025 (WIR 2026) – Change
- Top 10% income share – 57% – 58% – +1 ppt
- Top 1% income share – 21.5% – 22.6% – +1.1 ppt
- Bottom 50% income share – 13% – 15% – +2 ppt (but still very low)
- Top 10% wealth share – 63% – 65% – +2 ppt
- Top 1% wealth share – 38% – 40.1% – +2.1 ppt
The slight rise in bottom-50% share is largely because of pandemic cash transfers and rural wage growth in 2022–23, but the trend reversed in 2024–25.
Why Is India’s Inequality Rising So Fast?
The report lists four India-specific drivers:
- Skill-biased technological change favouring high-skill urban jobs
- Privatisation and crony capitalism – super-normal profits concentrated in a few hands
- Weak labour laws & low unionisation – real wages stagnant for bottom 60%
- Regressive taxation – India’s tax-to-GDP ratio (17%) is lower than Brazil (33%) and even the US (27%); billionaires pay lower effective rates than middle-class salaried employees
Policy Prescriptions from the Report
- Progressive wealth tax of 2% on net worth above ₹10 crore (could raise 1.5–2% of GDP)
- Inheritance tax reintroduction (last abolished in 1985)
- Super-tax on top 1% incomes
- Universal basic services (free education, healthcare, childcare) instead of cash transfers alone
India’s growth story is real – average per capita income rose from €1,900 in 2014 to €6,200 (PPP) in 2025.
But the fruits are overwhelmingly going to the top.
As Thomas Piketty warned in the preface:
“India is on track to become the world’s most unequal large economy by 2030 if current trends continue.”
The World Inequality Report 2026 isn’t just data – it’s a policy alarm bell ringing at full volume. Whether India chooses redistribution or lets inequality spiral further will define the next decade.