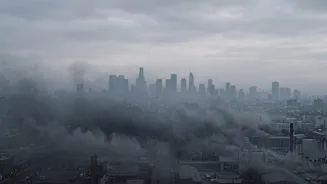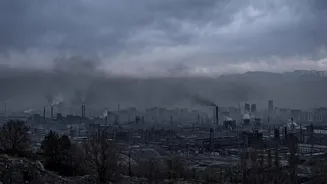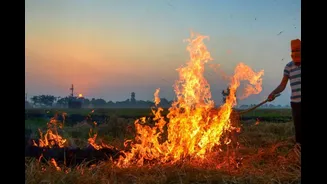





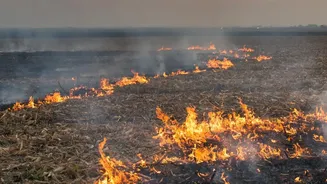
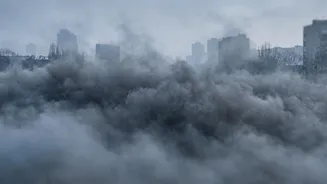
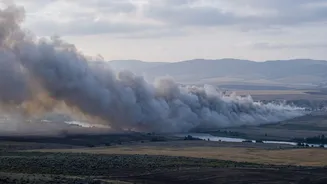
Smoke from stubble-burning fires in Punjab and Haryana was a major factor behind the sharp deterioration in Delhi’s air quality on Sunday, pushing pollution levels into the ‘very poor’ category on Monday.
According to an analysis by Hindustan Times based on air-quality, weather and satellite data, most farm fires were set alight during the evening, after the NASA satellite used for the standard measurement of stubble-burning incidents had already passed over the region.
Delhi’s Air Quality Index (AQI), measured on a scale of 0 to 500, climbed sharply from 117 on Saturday to 261 on Sunday. The Central Pollution Control Board‘s (CPCB) hourly readings crossed the 300 mark by Monday morning, entering the ‘very poor’ category.
The 4 pm bulletin on Monday recorded an AQI of 324, marking the first ‘very poor’ reading of the season. The previous such reading this year was recorded on February 11.
Weather Conditions Alone Do Not Explain Pollution Spike
Weather conditions before the pollution surge were unfavourable, with weak winds and calm nights. However, similar conditions had prevailed on October 18 and October 28, when Delhi’s air quality was considerably better.
PM2.5, the fine particulate matter that poses serious health risks by penetrating deep into the lungs, provides a clearer picture of the deterioration. India’s prescribed daily average limit for PM2.5 is 60 micrograms per cubic metre.
Between 10 pm on November 1 and 6 am on Monday, the average PM2.5 concentration in Delhi reached 194 micrograms per cubic metre, exceeding the permissible limit by more than three times. The corresponding averages on October 18 and October 28 were 68 and 127, respectively.
Weather conditions were assessed using three parameters based on India Meteorological Department (IMD) weather balloon observations and data from the Safdarjung airfield: the afternoon wind’s ability to disperse pollutants, the strength of the morning temperature inversion and the extent of calm conditions during the night.
A temperature inversion acts as a barrier, preventing air close to the ground from rising and mixing with the atmosphere above.
The comparison showed that October 18 and October 28 experienced weather conditions that were equally unfavourable, if not worse, than those on November 1. Both nights were completely calm, and the inversion layer was at least as strong. Despite this, PM2.5 levels on November 1 were almost three times those recorded on October 18 and around 50% higher than on October 28.
Rain-Related Improvement Was Not The Reason For The Surge
Rainfall on October 29 and 30 helped clear the air, bringing Delhi’s AQI down to 60 on Friday. Since the AQI represents the average pollution level over the preceding 24 hours, the index was expected to rise as the cleaner hours gradually moved out of the calculation.
However, hourly pollution readings indicated that Delhi’s air was already almost as polluted on the morning of November 1 as it had been on October 28. The two days followed different trajectories thereafter.
Pollution Levels Increased During The Day
Typically, pollution accumulated near the ground overnight begins dispersing as sunlight heats the surface and causes the air to circulate. This upward movement helps dilute pollutants trapped close to the ground, including emissions from traffic.
On October 28, PM2.5 concentrations dropped by nearly two-thirds by mid-afternoon. On October 18, the decline was more than 50%. November 1, however, followed a different pattern, with afternoon PM2.5 levels marginally higher than those recorded in the morning.
Such a pattern indicates either that pollution levels at higher altitudes were comparable to those near the surface or that contaminated air was entering the city from outside.
The additional pollution had started becoming evident a day earlier. Around midday on October 31, PM2.5 concentrations almost doubled within three hours, marking the sharpest midday increase recorded this season. Levels remained elevated through Monday morning.
The composition of particulate matter also pointed towards smoke. On the night of November 1, fine particles accounted for nearly 60% of the total particulate matter by weight, compared with slightly more than 40% on October 18 and October 28. Smoke predominantly consists of fine particles, whereas road and construction dust is largely coarse.
Evening Farm Fires Missing From NASA’s Satellite Count
NASA’s satellite-based fire count is widely used to track stubble burning. However, the satellite passes over Punjab only once daily, at approximately 1.30 pm, potentially missing fires started later in the day.
According to the Stubble Burning Status Report 2025 published by New Delhi-based research organisation iFOREST, more than 90% of large fires in Punjab during 2024 and 2025 were ignited after 3 pm. In comparison, only 3% of the fires in 2021 were reported during this period.
Geostationary satellite data, which provides continuous observations of the same geographical area throughout the day, was also examined to track the trend. While these satellites have lower image resolution than NASA’s satellite and detect only larger or more intense fires, they help establish when farm fires occur.
During the previous season, 99% of the fires detected by India’s INSAT-3DS satellite across Punjab and Haryana were found to be burning after 3 pm.
The satellite recorded almost no evening fires between October 15 and 28 this season. However, the numbers subsequently increased each day, rising from 17 on October 29 to 90 on November 1. Since INSAT-3DS detects only relatively large fires, the actual number of fields being burned is likely to be much higher.
NASA’s satellite count also increased, reaching 171 fires on November 1, the highest figure recorded this season. However, the count did not consistently correspond with Delhi’s pollution levels during October.
On October 18 and October 28, NASA recorded more than 100 fires on each day, even though Delhi’s afternoon air quality was cleaner than usual for the season. The direction of the winds was a key difference.
North-Westerly Winds Carried Smoke Towards Delhi
Transport-level winds, which move pollution across long distances at altitudes ranging from a few hundred metres to around two kilometres, came from the north-west on the afternoons of October 31 and November 1, according to weather balloon observations at Safdarjung.
The north-western direction corresponds with the major stubble-burning areas of Punjab and Haryana. On October 28, however, the winds came from the south.
Wind patterns from two global weather models were also examined to establish the areas over which the air reaching Delhi had travelled during the preceding three days.
The findings indicated that the air arriving in Delhi on November 1 had spent most of the previous three days over Punjab and Haryana, crossing several areas where satellites had detected fires a day earlier.
In contrast, the air reaching the capital on October 28 had travelled from the east, away from the stubble-burning belt, and passed over relatively few fire locations.
Although the air on October 18 had also travelled across Punjab, it did so before the evening farm fires began. Delhi consequently experienced comparatively cleaner air that day.
What The Data Cannot Establish
HT’s analysis does not establish the precise proportion of Delhi’s pollution on November 1 that came from stubble-burning smoke. High humidity following the rainfall could also have contributed to the deterioration, as moisture in the atmosphere can facilitate the conversion of certain gases into fine particles.
Humidity exceeded 90% on the nights of October 31 and November 1, compared with 76% on October 28. However, conditions were equally humid on October 31, while afternoon pollution levels were significantly higher on November 1.
NASA’s cumulative fire count for the season remains approximately 25% lower than the corresponding figure for the same period last year. However, the lower tally may not necessarily indicate a reduction in the number of fields being burned, as a majority of the fires are now reportedly taking place after the satellite’s daily pass.
Meanwhile, INSAT-3DS data showed that the number of evening fires in Punjab and Haryana was still increasing as of November 1.