



What's Happening?
Interactive Brokers, through third-party content from Seasonax, has highlighted historical seasonal patterns in gold and silver prices, indicating favorable periods for these precious metals. The analysis suggests that both gold and silver exhibit seasonal strength
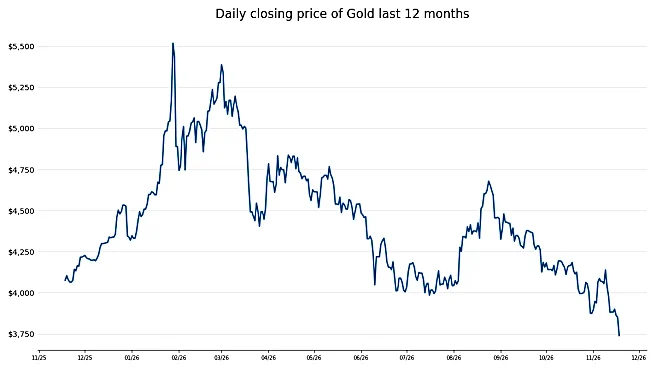
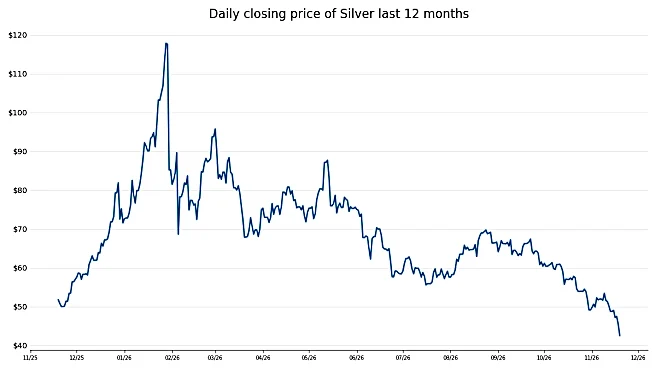
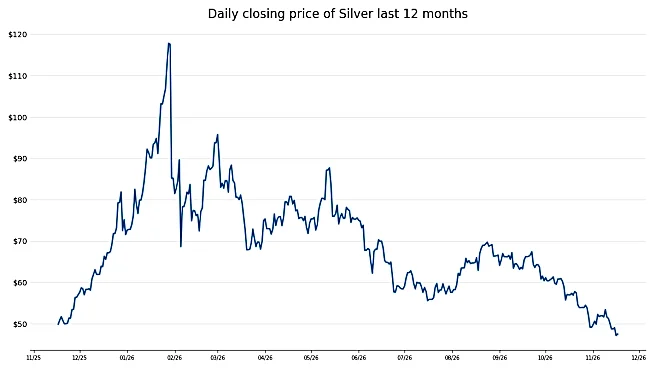
from November 11 to April 18, with a 90% win rate over the last 10 completed seasonal periods. Gold has shown an average return of +11.69% during this longer window, while silver has averaged +11.10%. A closer examination of shorter winter windows reveals that gold typically performs consistently from December 13 to February 20, with a median return of +6.83%. Silver, on the other hand, shows a higher average return of +9.20% from December 11 to January 29, but with greater volatility and a lower median return of +2.63%, influenced by exceptionally strong years. The report notes that concerns over inflation, energy prices, government borrowing, and interest rates are keeping precious metals in focus, with a potential weakening of the U.S. dollar also contributing to demand.
Why It's Important?
This analysis from Interactive Brokers is important for U.S. investors and financial market participants as it provides data-driven insights into potential seasonal opportunities in the precious metals market. Understanding these historical patterns can inform investment strategies, particularly for those looking to diversify portfolios or hedge against inflation and economic uncertainty. The distinction between gold's consistent returns and silver's higher volatility but greater upside potential allows investors to tailor their approach based on risk tolerance and investment objectives. The discussion of factors like inflation worries and potential U.S. dollar weakening underscores the broader economic context influencing precious metal demand, offering a perspective on how macroeconomic trends can intersect with seasonal market behaviors. For traders, identifying these windows could lead to more informed entry and exit points, potentially enhancing returns or managing risk.
What's Next?
As the end of 2026 approaches, investors will likely monitor the performance of gold and silver in line with these identified seasonal trends. The report suggests that the combination of seasonal strength, ongoing inflation uncertainty, fiscal concerns, and potential shifts in Treasury yields makes both metals worth watching. Market participants may consider adjusting their portfolios to capitalize on these historical patterns, potentially increasing demand for gold and silver during the highlighted favorable periods. Further analysis will likely focus on whether current market conditions, such as the U.S. dollar's performance and real yields, align with the historical contexts that have previously driven these seasonal gains. The behavior of these metals in the coming months will provide a real-time test of the predictive power of these seasonal analyses.
Beyond the Headlines
Beyond the immediate trading implications, the emphasis on seasonal patterns in precious metals highlights a broader aspect of market analysis: the interplay between fundamental economic factors and cyclical market behavior. While macroeconomic indicators like inflation and interest rates provide the foundational context for precious metal valuations, seasonal trends offer a layer of tactical insight. This approach encourages investors to look beyond daily news cycles and consider longer-term, recurring market dynamics. The differing characteristics of gold (consistency) and silver (volatility and industrial demand) also underscore the importance of understanding the unique drivers for each commodity, even within the same asset class. This detailed seasonal analysis, provided through platforms like Interactive Brokers, empowers individual investors with tools traditionally used by institutional traders, democratizing access to sophisticated market insights.