







What's Happening?
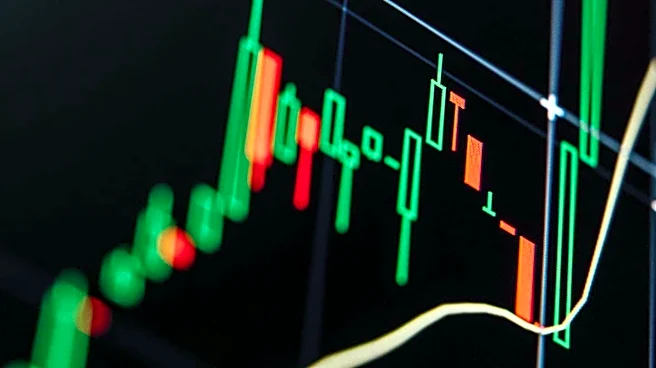
A 'bullish engulfing pattern' is a significant two-candle reversal signal observed in stock trading, typically forming after a price decline. This pattern consists of a red candle, indicating selling pressure, immediately followed by a larger green candle.
The key characteristic is that the green candle's body opens at or below the red candle's closing price and closes above the red candle's opening price, effectively 'engulfing' the entire body of the preceding red candle. This formation signifies a strong shift in market sentiment, indicating that buyers have overcome sellers and are now in control. The pattern's reliability is enhanced when it appears at a fresh demand zone, after a clear downtrend, and features a large green body, especially if it aligns with the higher-timeframe trend. The stop loss for trades based on this pattern is typically placed below the lower of the two candles' lows or below the demand zone's distal line.
Why It's Important?
The bullish engulfing pattern is crucial for traders and investors as it provides a visual and relatively clear indication of a potential trend reversal from bearish to bullish. Recognizing this pattern can help market participants identify opportune entry points for long positions, aiming to capitalize on an anticipated upward price movement. Its significance is amplified when it occurs in conjunction with other technical indicators, such as demand zones, which further validate the potential for a price rebound. For individual investors, understanding this pattern can improve decision-making, potentially leading to more profitable trades and better risk management by setting appropriate stop-loss levels. Conversely, ignoring such signals could lead to missed opportunities or continued losses in a declining market, making it a fundamental concept in technical analysis for those involved in the U.S. stock market.
What's Next?
Traders who identify a bullish engulfing pattern will typically look for confirmation from subsequent price action or other technical indicators before entering a trade. This might involve observing if the price continues to move upward in the following candles or if other bullish signals emerge. The pattern suggests that the immediate future price direction is likely to be upward, at least in the short term. Market participants will monitor the volume accompanying the engulfing candle, as higher volume can lend more credibility to the reversal signal. If the pattern holds, it could lead to a short-term rally in the stock's price. However, if the price falls back below the pattern's low, it would invalidate the signal, indicating that buyers did not maintain control and sellers have regained dominance.
Beyond the Headlines
Beyond its immediate utility as a trading signal, the bullish engulfing pattern reflects a fundamental psychological shift in market dynamics. It visually represents a moment where collective fear or pessimism (represented by the red candle) is decisively overcome by renewed confidence and buying interest (represented by the green candle). This pattern underscores the interplay between human emotion and market behavior, illustrating how sentiment can rapidly change and drive price action. The concept also highlights the self-fulfilling prophecy aspect of technical analysis, where widespread recognition and acting upon such patterns can contribute to the very price movements they predict. Understanding this pattern offers insights not just into price charts, but into the underlying human psychology that drives market trends, making it a valuable tool for comprehending broader market sentiment shifts.