



What's Happening?
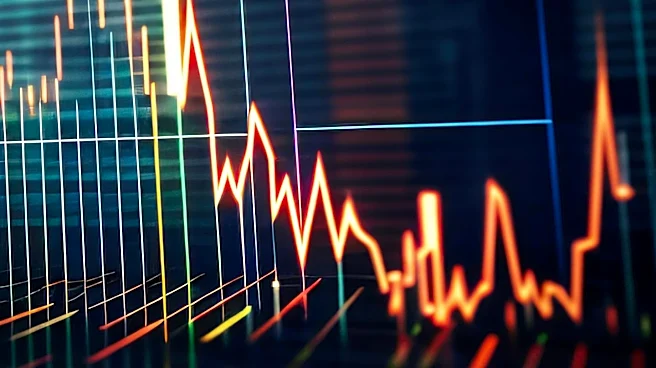
The CBOE Volatility Index (VIX), often referred to as Wall Street's 'fear gauge,' has shown considerable fluctuation throughout November. On November 4, the VIX closed at 16.61, only to surge to 28.18 the very next trading day, marking its largest single-day
increase since April. This spike, however, was temporary, with the VIX easing back to 17.49 by November 11. The index then rose again, closing at 25.46 on November 17 and 24.56 on November 19. These movements indicate a 40.4% increase for the week and a 33.2% rise for the month. Despite these volatility spikes, the S&P 500 (SPY) fell 5% from November 4 to November 18 but remained up 7% for the year. The VIX measures the expected size of S&P 500 movements over the next month, with higher readings indicating that traders are paying more for protection against large price swings, regardless of direction.
Why It's Important?
The erratic behavior of the VIX is important for U.S. investors and financial markets as it signals heightened uncertainty and a greater demand for market protection. While the S&P 500 has maintained a positive year-to-date return, the rapid and significant VIX movements suggest underlying investor apprehension. This increased volatility can lead to more cautious investment strategies, as traders anticipate larger price swings. For options traders, a high VIX means higher premiums for protection, impacting hedging costs and potential returns. The phenomenon of 'fear spikes' arriving quickly and fading slowly can lead to investors locking in losses if they sell during a VIX surge, highlighting the psychological impact of market volatility on decision-making. The VIX's role as a forward-looking indicator provides a glimpse into market sentiment, influencing how investors perceive risk and allocate capital.
What's Next?
Market participants will continue to closely monitor the VIX for further indications of volatility. While the VIX does not predict the direction of market movements, its sustained elevation or further sharp increases could signal ongoing investor caution and potentially more turbulent trading sessions. The causes of these recent swings have not been definitively confirmed, suggesting that various factors could be contributing to the market's unease. Investors may adjust their portfolios to account for potential larger price swings, possibly increasing their allocation to less volatile assets or employing hedging strategies. The market's ability to absorb these volatility spikes while the S&P 500 remains positive for the year suggests a degree of resilience, but sustained high VIX levels could eventually impact broader market confidence and investment flows.
Beyond the Headlines
The VIX's fluctuations underscore a deeper dynamic within financial markets: the interplay between perceived risk and actual market performance. While often dubbed the 'fear gauge,' the VIX primarily reflects the cost of options-based protection, which rises with expected uncertainty in either direction, not solely pessimism. This distinction is crucial, as a high VIX doesn't necessarily forecast a market crash but rather anticipates larger price movements. The historical pattern of mean reversion in VIX readings suggests that high volatility tends to subside over time, though the duration is unpredictable. This highlights the challenge for investors in distinguishing between temporary market jitters and more fundamental shifts. Understanding the VIX's limitations—that it's not directional and covers a specific time horizon and market—is essential for a nuanced interpretation of market sentiment beyond simplistic 'fear' narratives.