



Seeing the Invisible Heat
To map a distant world, you first need to see it. But exoplanets, planets outside our solar system, are impossibly faint and lost in the glare of their parent stars. The key is to look not for reflected light, as we see with our eyes, but for heat. Giant
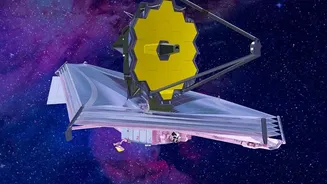
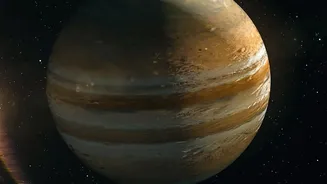
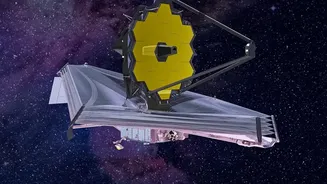
gas planets, especially those orbiting very close to their stars—known as 'hot Jupiters'—are incredibly hot, radiating their own thermal glow. This glow is invisible to optical telescopes but shines brightly in infrared light. Powerful instruments, most notably the James Webb Space Telescope (JWST), are designed specifically to capture this infrared radiation. By focusing on these wavelengths, astronomers can bypass the star's overwhelming visible light and directly measure the heat pouring off the planet itself.
The Art of Cosmic Subtraction
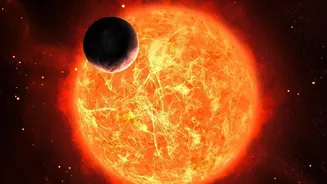
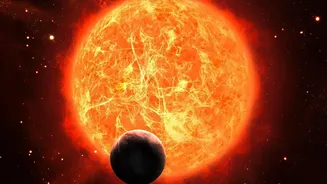
Even in infrared, separating a planet's light from its star's is a challenge. Scientists use a clever technique that relies on the planet's orbit. As the planet travels around its star, we observe the total light coming from the system. The crucial moment comes during the 'secondary eclipse', when the planet disappears behind its star from our point of view. In that instant, the total light we detect drops slightly, because only the star is visible. By subtracting this 'star-only' light from the 'star-plus-planet' light measured just before the eclipse, astronomers can isolate the light emitted solely by the planet’s dayside. It’s a brilliant act of cosmic accounting that gives scientists the pure signal of the planet itself.
Building a Map, Phase by Phase
A single measurement gives you the temperature of one side of the planet. To build a full map, astronomers watch the planet through its entire orbit, a technique called 'phase curve' mapping. Much like our Moon has phases, an exoplanet shows different faces to us as it orbits. By continuously measuring the changes in infrared brightness as the planet rotates, scientists can piece together a longitudinal map of its temperature. For a tidally locked planet, where one side always faces the star, this method reveals the stark temperature difference between the permanent, scorching dayside and the cooler nightside. The shape of this phase curve tells a detailed story about how the planet’s atmosphere circulates heat.
WASP-43b: A Real-World Weather Report
Let's look at a real example: WASP-43b, a hot Jupiter located about 280 light-years away. Observations of this planet, which is tidally locked and completes an orbit in a blistering 19 hours, have provided one of the most detailed exoplanet weather maps to date. Using data from both the Hubble and James Webb space telescopes, scientists mapped its extreme climate. The dayside sizzles at temperatures hot enough to melt steel, around 1,250 degrees Celsius. Meanwhile, the permanently dark nightside is covered in thick, high clouds and is significantly cooler, though still a formidable 600 degrees Celsius. The data also revealed ferocious equatorial winds whipping around the planet at speeds of up to 8,000 kilometres per hour, transferring heat from the day to the night side.
Beyond Temperature: Chemical Fingerprints
These weather maps are more than just about temperature. By using a technique called spectroscopy, astronomers can break down the planet's infrared light into its component wavelengths, creating a 'spectrum'. Different molecules in the atmosphere absorb light at specific, known wavelengths, leaving behind unique chemical fingerprints in the spectrum. For WASP-43b, analysis of its spectrum confirmed the presence of water vapour across the planet. More recent studies using JWST data have even found the first significant evidence of ammonia and carbon monoxide in its atmosphere, offering deeper clues into how these giant planets form and evolve. This allows scientists to add layers of chemical information to their weather maps, showing not just how hot it is, but also what the air is made of.