



The Unique Challenge of Urban Weather
Predicting weather in dense cities isn't like forecasting for open plains. Urban areas create their own microclimates. Concrete and asphalt absorb and radiate more heat than natural landscapes, creating what is known as an 'urban heat island' effect.
This pocket of warmer air can cause rising air currents, which in turn can trigger or intensify rainfall over and downwind of the city. Furthermore, the sheer physical presence of tall buildings can alter wind patterns, forcing air to rise or converge in unpredictable ways. This complexity means that storms can form, strengthen, or even split apart based on the city's unique layout, making standard forecasting models less reliable. To get an accurate picture, forecasters need to see more than just what's visible to the naked eye.
Seeing Beyond a Simple Photograph
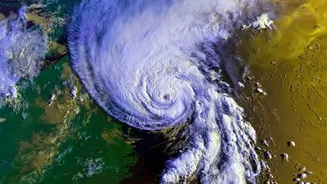
When we look at a typical satellite image on a news broadcast, we're usually seeing a 'visible' image, which is essentially a black-and-white photograph from space. It's great for showing us where clouds are, but it has limitations. For one, it only works during the day when sunlight is reflecting off the clouds. It also doesn't tell us much about the cloud's structure—its height, temperature, or how much water it holds. Just because a cloud looks dark and grey doesn't guarantee it will produce heavy rain. To understand a storm's potential, meteorologists need to analyse it across different, invisible wavelengths of light, or spectra. This is where multi-spectrum imagery comes in.
Breaking Down the Spectrum
Multi-spectrum satellite imagery combines data from several different 'channels' that measure energy beyond visible light. For weather forecasting, the three most crucial channels are Visible, Infrared (IR), and Water Vapor. Think of it like having three different types of vision. The visible channel shows you what a cloud looks like. The infrared channel shows you how warm or cold it is. The water vapor channel shows you the invisible moisture flowing through the atmosphere. By layering these three views, forecasters can build a far more detailed and dynamic model of the atmosphere. Each channel provides a unique piece of the puzzle.
The Power of Infrared (IR) Imagery
Perhaps the most critical tool for predicting rain is infrared imagery. IR sensors on satellites don't measure light; they measure heat. This allows them to work day and night. In meteorology, temperature is a key indicator of a storm's strength. As air rises and forms clouds, it cools. Taller storm clouds, which have more power to produce heavy rain, have much colder tops than lower, less threatening clouds. Infrared images display these temperature differences, often using a colour scale where bright white or vibrant colours represent the coldest, highest cloud tops. By tracking the temperature of a storm system, forecasters can assess whether it is strengthening or weakening and pinpoint the areas most likely to experience intense rainfall.
Tracking a Storm's Fuel Source
A storm can't form without moisture. Water vapor imagery is designed to detect this crucial ingredient in the mid and upper levels of the atmosphere. This channel is sensitive to radiation absorbed by water molecules, allowing it to map plumes of moisture even in areas with no visible clouds. On these images, bright white areas indicate high moisture content, while dark areas signify dry air. This view is invaluable for identifying the 'atmospheric rivers' that feed storm systems and for seeing where new storms might develop. It helps meteorologists understand not just where the weather is, but where it's likely headed.
A Complete Picture for a Complex Forecast
By combining these different spectral layers, meteorologists get a three-dimensional understanding of a weather system. They can see the visible cloud structure, identify the height and intensity through infrared data, and track the flow of moisture with water vapor imagery. In India, the India Meteorological Department (IMD) leverages a series of advanced satellites, like the INSAT series, which are equipped with multi-spectral imagers to provide this crucial data every 15 minutes. This high-resolution, multi-layered view allows forecasters to see how a storm is interacting with a city's unique environment—like its heat island—and issue more precise, timely warnings for flash floods and heavy rain. It transforms forecasting from a simple picture into a detailed diagnostic tool.