

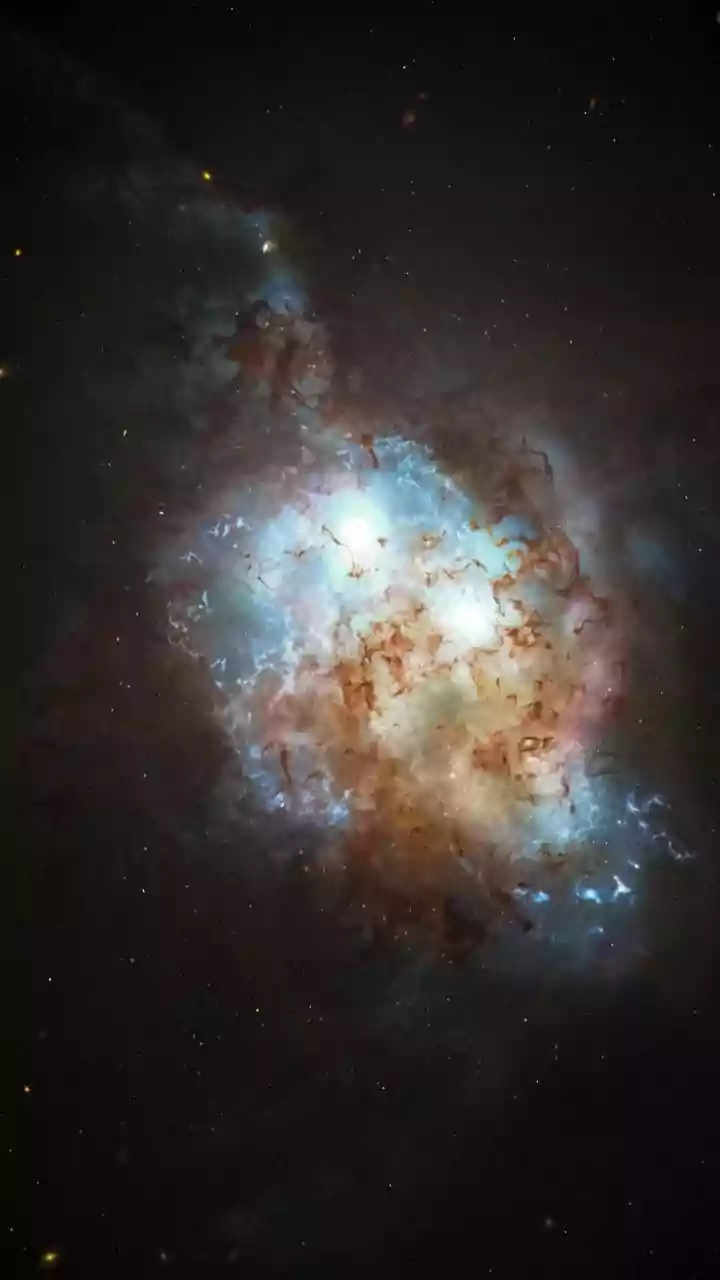





Cosmic Fireworks
In early July 2026, to mark the 250th birthday of the United States, NASA released a special collection of images that put a celestial spin on the patriotic colour scheme. The images, primarily from the Chandra X-ray Observatory combined with data from the Hubble
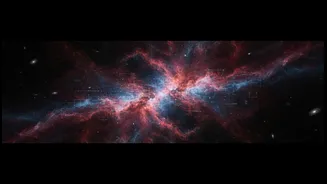
and James Webb Space Telescopes, feature breathtaking objects like the Cassiopeia A supernova remnant and the massive galaxy cluster ZwCl 0024+1652. In one image, the ghostly remnants of an exploded star swirl in hues of red and blue; in another, a distant galaxy cluster glows with a deep red haze. While the timing and colour choice were clearly intentional, the application of these colours is far from arbitrary. They are a deliberate translation of complex scientific data into a language our eyes can understand.
Seeing the Invisible
The fundamental secret behind these vibrant images is that they are not photographs in the way we typically think of them. Telescopes like Chandra, Webb, and Hubble are designed to see the universe in wavelengths of light that are completely invisible to the human eye. Our eyes can only perceive a tiny slice of the electromagnetic spectrum known as visible light. These powerful observatories, however, can detect everything from high-energy X-rays to low-energy infrared light. When these telescopes capture an image, they don't see colour at all. Instead, they record the intensity of light, producing a series of black-and-white images. Each image is taken through a specific filter that isolates just one narrow band of light, corresponding to a particular element like hydrogen or a specific energy level.
The Data-to-Color Translation
This is where the “data twist” comes in. Image processing specialists at agencies like NASA take these separate black-and-white datasets and assign a visible colour to each one. This process is often called “false-colour” or “representative-colour” imaging. Typically, they follow a chromatic order: the longest wavelengths of light detected are assigned to the red channel, medium wavelengths to green, and the shortest to blue. For the recent anniversary images, scientists mapped X-rays from Chandra, which reveal incredibly hot and energetic phenomena, to blue or red. Infrared light from Webb, which is excellent at piercing through cosmic dust, was often assigned to red and white. By combining these coloured layers, they create a single composite image that is both scientifically informative and visually spectacular.
A Palette for Discovery
This technique is not about making things up or being deceptive; it's a vital tool for scientific discovery. By assigning different colours to different elements, scientists can instantly see the chemical composition and physical structure of a distant nebula or galaxy. For example, in the famous “Hubble Palette,” light from sulfur is assigned to red, hydrogen to green, and oxygen to blue. This allows astronomers to distinguish between different gas clouds that might otherwise look identical. It reveals structures, temperatures, and densities that would be completely hidden in what we might consider a “natural colour” photo. The goal is to translate vast amounts of invisible data into a visual format that highlights the most important scientific story the object has to tell. It’s a unique intersection of hard data and creative interpretation, where art serves science.