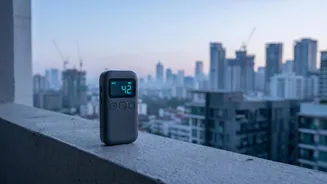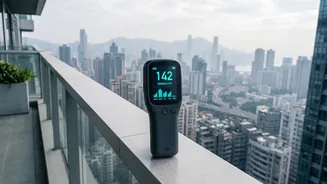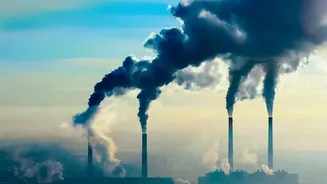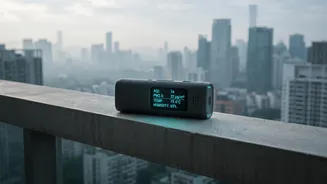








As Diwali approaches, the joy of the festival of lights is often accompanied by a significant spike in air pollution. Knowing the quality of the air you breathe is the first step towards protecting your health during the celebrations.
Decoding the Air Quality Index (AQI)
Before you start
tracking, it's crucial to understand what the numbers mean. The Air Quality Index, or AQI, is a simple tool that converts complex air pollutant data into a single number, a colour code, and a health advisory. In India, the Central Pollution Control Board (CPCB) uses a 0-500 scale divided into six categories. A lower number means better air quality. 'Good' (0-50) is green, while 'Severe' (401-500) is maroon, indicating hazardous conditions. The index primarily tracks eight major pollutants, including fine particulate matter like PM2.5 and PM10, which are major concerns during Diwali due to firecracker emissions. Any reading above 100 ('Moderate') can start causing breathing discomfort for people with lung or heart conditions.
Official Government Apps and Portals
For the most authoritative data, government-backed platforms are your best bet. The primary tool is the 'SAMEER' app, developed by the CPCB. It provides hourly AQI updates directly from the government's official network of over 790 monitoring stations across the country. You can view a colour-coded map, check data for your city, and even register complaints about air pollution violations like garbage burning. Another key resource is the System of Air Quality and Weather Forecasting and Research (SAFAR), an initiative by the Ministry of Earth Sciences. The SAFAR portal is especially robust for major metropolitan areas like Delhi, Mumbai, Pune, and Ahmedabad, providing not just real-time data but also forecasts up to 72 hours in advance. This helps in planning activities to avoid peak pollution times.
Popular and Reliable Third-Party Trackers
Several globally recognised third-party applications offer comprehensive and user-friendly ways to track air quality. 'IQAir AirVisual' is a popular choice, combining data from government monitors, its own sensors, and satellite imagery to provide hyperlocal readings and seven-day forecasts. Its 3D pollution map is a unique feature for visualising air quality trends. Another option is 'Plume Labs: Air Report', which is now part of AccuWeather. It excels at providing forecasts and activity-specific recommendations, advising whether it's a good time to go for a run or have children play outdoors. Even Google Maps has integrated a real-time AQI layer in India. By tapping the 'layers' icon, you can see a colour-coded overlay of air quality on the map, making it easy to check conditions at a glance while navigating.
How to Use the Information for Your Health
Monitoring the AQI is only useful if you act on the information. When the AQI enters the 'Poor' (201–300) or 'Very Poor' (301–400) categories, it's a signal for everyone, not just vulnerable individuals, to reduce prolonged or heavy outdoor exertion. During these times, it's advisable to keep windows closed, especially during peak traffic hours, and use an air purifier indoors if you have one. If you must go out, wearing a wellfitted N95 mask can help filter out harmful PM2.5 particles. For people with preexisting conditions like asthma or heart disease, children, and the elderly, these precautions become even more critical. If the AQI reaches 'Severe' levels, it is best to avoid all outdoor physical activity. Staying hydrated and eating a diet rich in antioxidants can also help support your body's defence against pollutants.