


Cosmic Collisions: A Creative Force
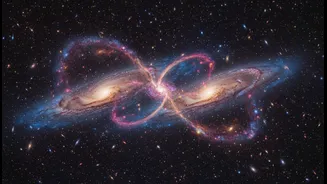
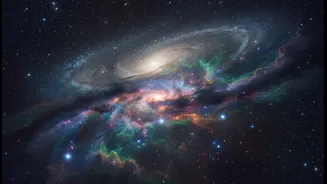
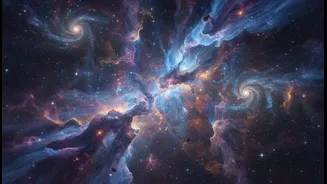
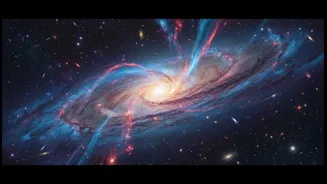
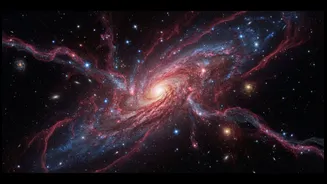
When galaxies merge, it's not just a simple crash. It’s a gravitational tango that can take hundreds of millions of years. During this process, vast clouds of interstellar gas and dust are violently disturbed. This gas is the raw fuel for star formation.
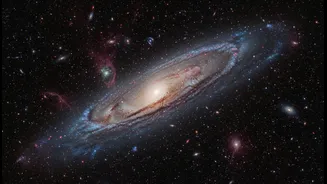
The collision can compress the gas, triggering a massive burst of new stars in what's known as a starburst galaxy. In some cases, the gas is superheated or ejected from the system entirely, effectively shutting down star formation. Understanding how this gas is displaced is fundamental to understanding how galaxies evolve, including our own Milky Way, which is destined to collide with the Andromeda galaxy in about 4.5 billion years.
Webb’s Infrared Superpower
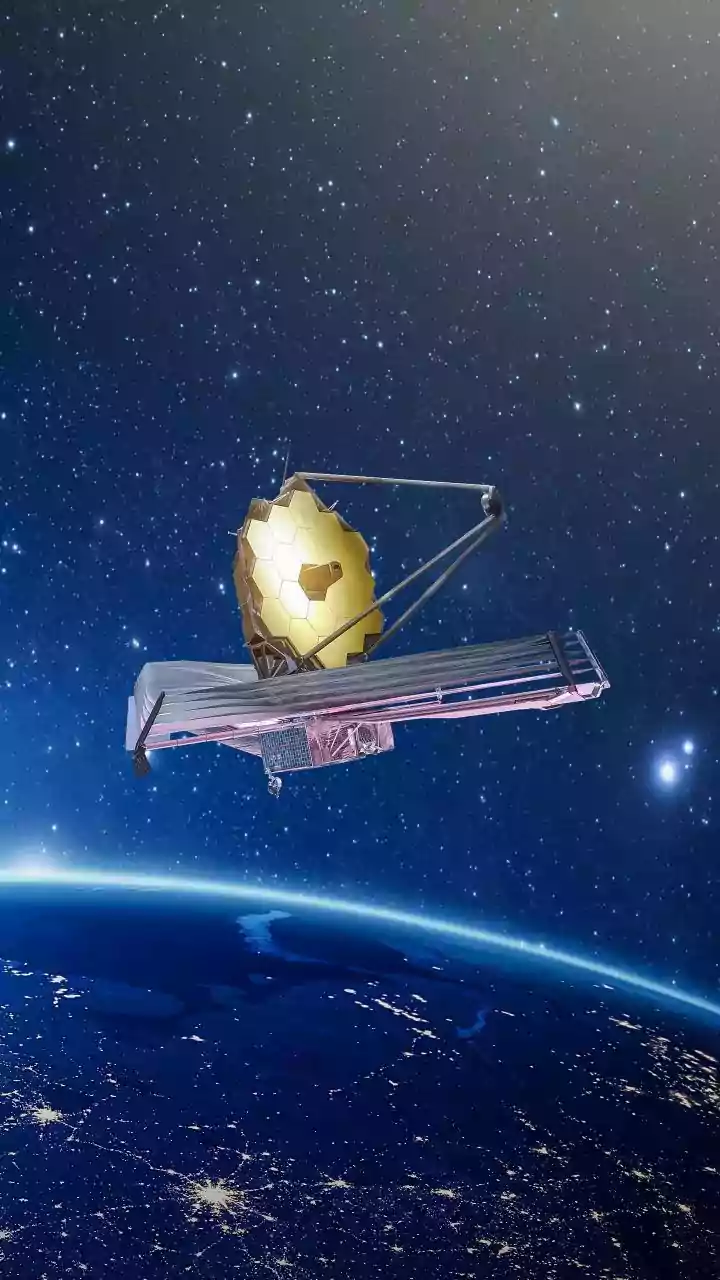
Previous telescopes like Hubble have given us stunning visible-light images of these mergers, but much of the action remains hidden. Galactic collisions are incredibly dusty affairs, and this dust acts like a shroud, blocking visible light. This is where the James Webb Space Telescope's specialty comes in. JWST is designed to see the universe in infrared light. Infrared wavelengths can penetrate these thick dust clouds, allowing scientists to peer into the heart of the chaos. This lets them observe the glowing gas, the newborn stars, and the active supermassive black holes that are often at the center of these cosmic smashups.
The Toolkit: MIRI and NIRSpec
To map the gas, JWST uses a pair of powerful instruments: the Mid-Infrared Instrument (MIRI) and the Near-Infrared Spectrograph (NIRSpec). These are not just cameras; they are primarily spectrographs. A spectrograph works by splitting light into its constituent wavelengths, much like a prism creates a rainbow. By analyzing this spectrum, scientists can identify the chemical makeup of the gas (like hydrogen, oxygen, and iron), its temperature, and its density. Most importantly, by measuring the Doppler shift in the light, they can calculate the gas's velocity—whether it's rushing towards us, away from us, or swirling in a disk.
Building a 3D 'Data Cube'
The real magic happens with a technique called Integral Field Spectroscopy. Both MIRI and NIRSpec have Integral Field Units (IFUs) that allow them to take a spectrum for every single pixel in a small patch of the sky. This creates what scientists call a 'data cube'. Imagine a stack of images: the first two dimensions are the spatial area (left-right and up-down), but the third dimension is wavelength. By slicing through this cube, astronomers can create detailed 2D maps that show not just where the gas is, but how fast it's moving at every single point. This is how they map the complex mechanics of gas outflows, shockwaves, and rotating disks that were previously impossible to resolve.
Case Study: Stephan's Quintet
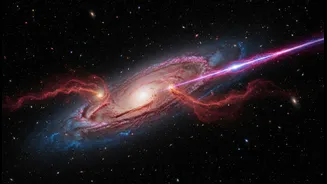
One of JWST's first major targets, Stephan's Quintet, provides a perfect example. Here, four galaxies are interacting closely. Webb’s observations revealed huge shockwaves, larger than our entire Milky Way, as one galaxy smashes through the others. Using the data cube from its instruments, scientists could map out massive outflows of gas being driven by the supermassive black hole at the core of one galaxy. They saw how this outflow slams into the interstellar gas, creating turbulence and triggering pockets of fresh star birth while also potentially clearing gas from other regions. These observations provide a detailed, real-world laboratory for testing theories of galaxy evolution.