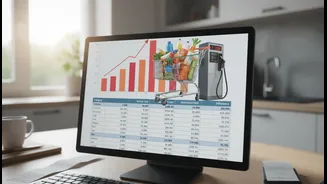









Check the Source and the Measure
The first step is to see where the information is coming from. In India, official inflation data is released by the National Statistical Office (NSO). Claims from official sources are the most reliable. Also, verify which measure is being discussed. The Consumer
Price Index (CPI) is the standard for retail inflation and what the Reserve Bank of India uses for its policy decisions. Another measure, the Wholesale Price Index (WPI), tracks prices at the wholesale level and can tell a different story. Always be skeptical of claims that don't specify the source or the index, as they can be misleading.
Headline vs. Core Inflation
Not all inflation is the same. You'll often see two main figures: headline and core inflation. Headline inflation is the overall number and includes all items in the measured basket. Core inflation, however, excludes volatile items like food and fuel. Why the distinction? A sudden spike in vegetable prices due to a bad monsoon could push headline inflation up temporarily, even if prices for most other goods and services are stable. Core inflation gives a better sense of the underlying, long-term trend in prices. When you see a dramatic claim, check if it's based on the more volatile headline number and compare it to the core figure for a more complete picture.
Year-on-Year vs. Month-on-Month
Inflation is about the rate of price change, so the comparison period matters immensely. The most commonly reported figure is the year-on-year (YoY) number, which compares prices in the current month (June 2026) to the same month last year (June 2025). You might also see month-on-month (MoM) data, which shows the change from the immediately preceding month (May 2026). MoM figures can be very volatile and may not indicate a lasting trend. A high MoM number could be a one-off blip, while the YoY number provides a broader perspective on the annual trend.
Understand the 'Base Effect'
This is one of the most important but least understood concepts. The base effect refers to how the inflation rate from the previous year can distort the current year's numbers. For example, if inflation was unusually low in June of last year, even a moderate price increase this June will look like a huge spike in percentage terms. Conversely, if last June saw very high inflation, this year's figure might look deceptively low, even if prices are still rising. Always ask: what was happening with prices a year ago? This context is essential to avoid being misled by statistical distortions.
Look Inside the Basket
A single inflation number is an average of price changes across a wide variety of goods and services. The overall CPI might be moderate, but the costs that affect you personally—like rent, education, or healthcare—could be rising much faster. Official reports break down inflation by category. Look at what's driving the change. Is it a broad-based price rise across many sectors, or is it concentrated in one or two areas, like food or transport? This helps you understand the real-world impact beyond the single headline number. An individual's personal inflation rate can feel very different from the official national average.
A Lower Inflation Rate Doesn't Mean Prices Are Falling
This is a common point of confusion. If inflation drops from 6% to 4%, it does not mean things are getting cheaper. It only means that prices are increasing at a slower rate than before. Prices are still going up, just not as fast. A situation where prices actually fall is called deflation, which is a different and often more dangerous economic problem. So, when you see a headline celebrating 'falling inflation', remember that your cost of living is likely still rising, just at a more manageable pace.