


A New Window into a Cosmic Collision
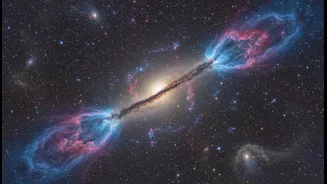
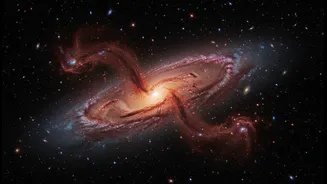
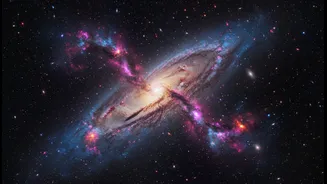
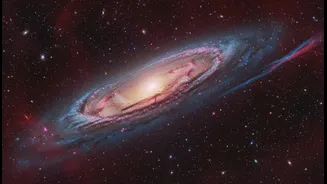
To understand the new image's impact, it helps to know what we're looking at. Centaurus A, located a relatively close 11 million light-years away, is not a typical galaxy. It's the result of a colossal merger between two galaxies that happened around
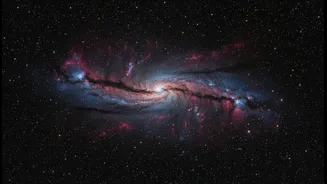
two billion years ago. This collision left it with a peculiar shape, vast ribbons of dust, and a supermassive black hole at its core that is actively feeding on surrounding gas. Previous telescopes like Hubble were blocked by these thick dust lanes, unable to see the heart of the action. Webb’s powerful infrared vision, however, cuts straight through. The new image, released to mark the fourth anniversary of Webb's science operations, pierces the veil, revealing millions of individual stars and glowing filaments of gas in unprecedented detail. It transforms a familiar celestial object into a far richer and more complex landscape than ever seen before.
For Space Readers: A Story of Galactic Archaeology
For avid space and astronomy readers, the Centaurus A image is like finding a new chapter in a favorite book. For years, the story of this galaxy was incomplete, based on glimpses from different telescopes that couldn't see the whole picture. Now, Webb provides the missing pages. What previously looked like a hazy glow is now resolved into a dense field of millions of individual stars. This allows for what scientists call 'galactic archaeology.' By distinguishing between different generations of stars, researchers can reconstruct a timeline of the galaxy's dramatic history. They can identify which stars existed before the great collision, which were born during the chaotic merger, and which formed in the aftermath from the stirred-up gas and dust. This provides a clearer understanding of how galactic mergers—a fundamental process in the universe—drive star formation and how a central black hole shapes its host galaxy's evolution.
For Students: A Living, Interactive Textbook
The real game-changer for education is that this isn't just a static image; it's a dataset. The combined views from Webb's Near-Infrared (NIRCam) and Mid-Infrared (MIRI) instruments provide layers of information that can be explored. For students, this turns astronomy from a subject in a textbook into an interactive investigation. NASA has already released guided tours and interactive versions of the image that allow users to explore its features. Educators can use this to create dynamic lesson plans where students can zoom into star-forming nurseries, trace the mysterious 'S' shaped dust feature, and compare different wavelengths to see how they reveal different structures. Furthermore, the public data allows students to engage in real scientific practice, learning how astronomers process raw data to create these colourful and informative images. It’s a powerful tool for teaching data literacy, critical thinking, and the scientific method itself, using a subject that is visually captivating.
For Visual-Science Fans: Where Data Becomes Art
For those who appreciate the intersection of science and aesthetics, the Centaurus A image is a masterpiece of data visualization. The colours in the image are not what our eyes would see; they are representative colours assigned to different infrared wavelengths. This process, known as color mapping, is both a scientific and an artistic choice made to highlight specific features. The glowing orange and red hues show where dust is warmest, often indicating stellar nurseries where new stars are being born. The intricate, wispy filaments and warped parallelogram-like band of dust are rendered with a level of detail that is not only scientifically significant but also incredibly beautiful. It showcases how complex data can be translated into a compelling visual narrative, making abstract cosmic processes feel tangible and immediate. These images often find their way into digital art, design, and even music, through sonification projects that turn astronomical data into sound, providing another dimension of engagement.