

Seeing the Unseeable
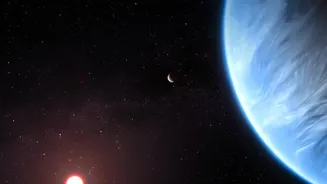
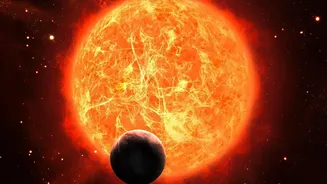
Mapping weather on an exoplanet—a planet outside our solar system—is one of astronomy's greatest challenges. These worlds are incredibly faint specks of light, often thousands of times dimmer than their host stars. From our perspective, they are so close
to their star's blinding glare that trying to see one directly is like trying to spot a firefly next to a searchlight from hundreds of kilometres away. This makes taking a simple picture of an exoplanet’s clouds impossible. Instead, astronomers must rely on indirect, almost Sherlockian methods to deduce what the climate is like on these distant, searing worlds.
The Power of Infrared Light
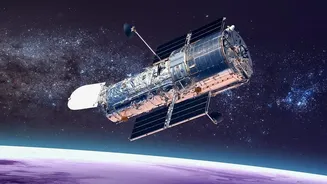
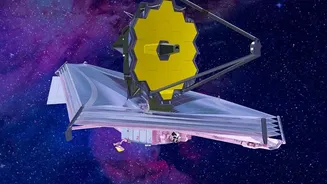
The key to this cosmic detective work is infrared light. Unlike visible light that our eyes can see, infrared light is a form of radiation we perceive as heat. Every object in the universe, from stars to planets to people, emits infrared light. The hotter an object is, the more infrared radiation it gives off. Telescopes like NASA’s James Webb Space Telescope (JWST) are designed to be exquisitely sensitive to this light. By capturing the faint heat signature of an exoplanet, astronomers can begin to measure its temperature from light-years away, providing the fundamental data point for any weather report. Infrared light can also pass through types of cosmic dust and gas that would block visible light, giving us a clearer view of distant planetary systems.
Decoding a Planet's Light
The primary technique for this work is called phase curve spectroscopy. It works best on 'hot Jupiters'—gas giants orbiting extremely close to their stars. As one of these planets completes its rapid orbit, we see it from different angles, just like the phases of our Moon. When its hot, star-facing 'dayside' is turned towards us, the whole system of star and planet appears slightly brighter in infrared. When its cooler 'nightside' faces us, the system is a bit dimmer. By continuously measuring these tiny fluctuations in brightness over a full orbit, scientists can mathematically subtract the star's constant light. What remains is the light coming solely from the planet itself. This allows them to create a map showing which parts of the planet are hotter and which are cooler.
Building a Cosmic Weather Report
A temperature map is the foundation for a weather report. Scientists can see the hottest point on the planet's surface and the coldest. Crucially, they can also see if the hottest point is where it's expected to be—directly facing the star. On many tidally locked planets, the hottest spot is found to be shifted eastward. This displacement is a massive clue: it’s direct evidence of powerful, supersonic winds blowing the heat around the planet. Furthermore, by analysing the specific wavelengths of infrared light being emitted or blocked, scientists can identify the chemical makeup of the atmosphere, including the composition of its clouds—which on these hot worlds can be made of vaporised rock and minerals instead of water.
A Look at a Hellish Forecast
A perfect example is the exoplanet WASP-43 b, located 280 light-years away. Using the JWST, scientists created a detailed weather map. They found it is tidally locked, with one side in perpetual daylight and the other in endless night. The dayside bakes at nearly 1,250 degrees Celsius, hot enough to melt iron. The nightside, while still scorching at 600 degrees Celsius, is cool enough for clouds to form—not of water, but likely of minerals. Most remarkably, the data reveals ferocious winds of over 8,000 kilometres per hour that whip from the dayside to the nightside, creating a truly extreme and dynamic global weather system. These winds are so fast they prevent certain gases like methane from forming, constantly churning the planet's atmosphere.