



The Planet's Frozen Archives
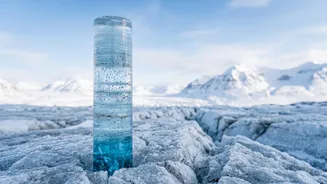
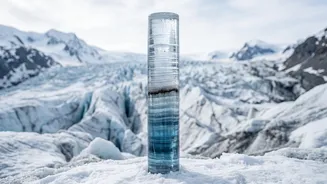
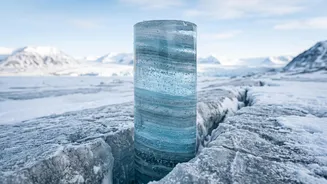
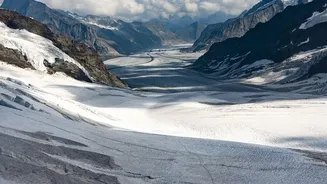
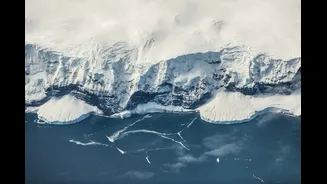
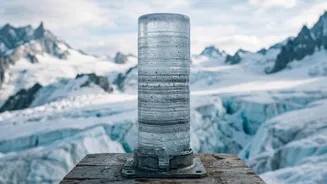
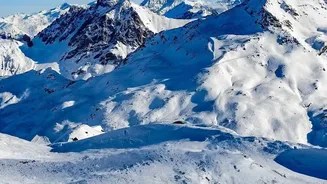
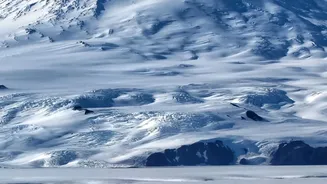
In the vast, frozen landscapes of Antarctica and Greenland, scientists drill deep into the ice, sometimes kilometers down, to retrieve cylinders of ice known as ice cores. These are not just frozen water; they are pristine historical archives. Each year,
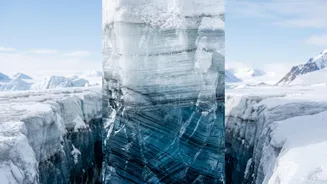
snowfall adds a new layer, which is then compressed by subsequent snow. Over centuries and millennia, these layers build up, trapping more than just ice. They capture bubbles of the ancient atmosphere, volcanic ash, and dust, providing a year-by-year record of Earth's environmental history stretching back as far as 800,000 years. By carefully analyzing these layers, much like counting the rings of a tree, scientists can create a detailed timeline of past climate conditions.
Water's Atomic Fingerprint
The key to unlocking past temperatures lies in the water molecules themselves. Water is H2O, but not all oxygen atoms are created equal. Most oxygen atoms have a mass number of 16 (Oxygen-16), but a small fraction are heavier, containing extra neutrons, creating Oxygen-18. These different versions of an element are called isotopes. While chemically identical, their slight difference in weight is crucial. Water molecules containing the lighter Oxygen-16 evaporate more easily from the ocean's surface than the heavier water molecules with Oxygen-18. This simple fact of physics is the foundation of one of the most powerful tools in paleoclimatology.
From Isotope Ratios to a Thermometer
As water vapor travels from warmer regions toward the cold poles, it gradually loses moisture as precipitation. The heavier Oxygen-18 condenses and falls as rain or snow more readily than the lighter Oxygen-16. This means that by the time an air mass reaches the frigid polar regions, it is significantly depleted of the heavier Oxygen-18. The amount of this depletion is directly related to temperature. In colder periods, there is less energy available to transport the heavy isotopes, so polar snow is extremely low in Oxygen-18. In warmer periods, more energy in the atmosphere allows more Oxygen-18 to make the long journey to the poles. Therefore, the ratio of Oxygen-18 to Oxygen-16 in the ice acts as a reliable proxy for the air temperature at the time the snow fell.
Drilling Down Through Time
In the lab, scientists use highly sensitive instruments called mass spectrometers to meticulously measure the isotopic ratios in samples taken from each distinct layer of an ice core. By analyzing the ice slice by slice, they can reconstruct a continuous temperature record. They compare the isotopic ratios found in the ice to a modern standard, which allows them to calculate the temperature of the past. Scientists have calibrated this 'isotope thermometer' by comparing the isotope ratios in recent snow layers with modern, directly measured temperatures, confirming a strong, linear relationship. This gives them confidence that the patterns they see in ancient ice accurately reflect historical temperature swings.
What This Frozen History Tells Us
These chemical signatures have revealed the great ice ages and the warmer interglacial periods that have defined Earth's climate for hundreds of thousands of years. They show how atmospheric carbon dioxide, measured from trapped air bubbles, has risen and fallen in lockstep with global temperatures. This data provides invaluable context for our current climate. The records show that while Earth's climate has always changed, the current rate of warming is roughly 10 times faster than the average rate of warming after an ice age. This detailed history, read from the subtle chemistry of ancient snow, provides some of the most unequivocal evidence for the unprecedented nature of modern climate change.