


The Challenge: A Region of Microclimates
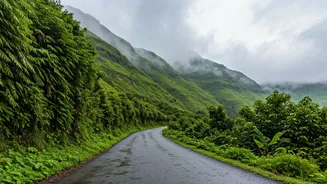
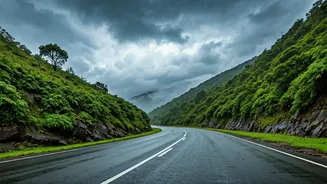
Anyone who has driven through the Western Ghats knows the drill. One moment you’re in bright sunshine, the next you’re engulfed in thick fog or a torrential downpour. This isn’t just bad luck; it’s the nature of the region’s complex geography. The Ghats create
numerous microclimates where weather conditions can change dramatically over just a few kilometres. During the monsoon, this volatility is amplified. A sudden, intense spell of rain can trigger landslides, cause flash floods on low-lying roads, and reduce visibility to almost zero. Traditional weather forecasts, which might give you a general prediction for an entire district, are often too broad to be useful for a driver navigating a specific ghat section. You need information that is real-time, localised, and dynamic.
Your New Co-Pilot: Live Weather Charts
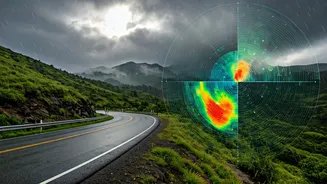
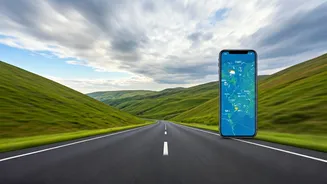
This is where live weather charts and radar maps come in. Unlike a static forecast that says “80% chance of rain,” these tools provide a visual, animated representation of weather systems as they move. Think of it as the difference between reading a traffic report and seeing a live Google Maps traffic overlay. One tells you there might be a jam; the other shows you exactly where it is, how bad it is, and whether it’s moving towards you. These charts, accessible via apps and websites, use data from Doppler weather radars and satellites to show you the precise location, intensity, and trajectory of rainfall. This transforms you from a passive victim of the weather into an active, informed decision-maker on the road.
How to Read the Digital Sky
At first glance, a weather radar can look intimidating, but you only need to understand a few basics. The most important feature is the colour-coded precipitation map. Typically, blue and green indicate light to moderate rain, while yellow, orange, and red signify heavy to extremely heavy rainfall. By playing the animation loop, you can see which direction these rain bands are moving. Are they heading away from your route or directly towards it? This simple observation can help you decide whether to wait out a storm at a café for 30 minutes or push on. Other useful features include lightning trackers (like the 'Damini' app), which are crucial for trekkers and bikers, and satellite layers that show overall cloud cover, giving you a bigger picture of the day’s weather patterns.
Essential Tools for Your Trip
For Indian road trips, a few tools are particularly reliable. The India Meteorological Department (IMD) offers the 'Mausam' app, which provides official radar imagery and district-level warnings. It’s a must-have for government-issued alerts. For more detailed, user-friendly visualisations, apps like 'Windy.com' and 'AccuWeather' are excellent. 'Windy.com', in particular, is a favourite among seasoned travellers for its multiple layers showing wind, rain, cloud base, and visibility. You can drop a pin on your exact route and get a highly localised, hour-by-hour forecast. Combining the official alerts from Mausam with the detailed visuals from an app like Windy gives you a comprehensive and reliable weather dashboard for your journey.
Putting It All into Practice
Let’s imagine you’re planning a drive from Bengaluru to Coorg during the monsoon. Before leaving, you check the radar. You see a large band of yellow and orange (heavy rain) hovering over the Charmadi Ghat section, but your intended route through Mysuru looks relatively clear, with only scattered green patches. An hour into your drive, you check again. You notice a new cluster of intense rain forming near Hunsur, about an hour ahead on your route. Thanks to this live data, you have a choice: you can either take a break at the next town to let it pass or, if available, consider an alternative local road to bypass the worst of it. This ability to anticipate and react in real-time is what makes these tools indispensable for safe and scenic travel.