







What is Orion Data, Anyway?
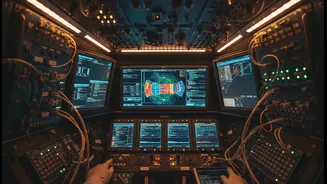
When we talk about data from the Orion spacecraft, it’s not just a single stream of numbers. It's a rich collection of information that tells the complete story of the mission. Think of it in three main categories. First, there's telemetry, which is the health
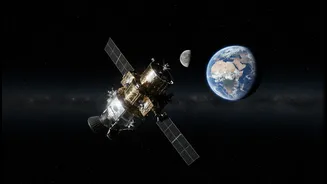
and status report of the spacecraft. This is like your car's dashboard, but for a vehicle traveling thousands of miles an hour through deep space. It includes everything from cabin temperature and pressure to fuel levels and power generation from the solar arrays. Second is the imagery. This is the most visually compelling data, including photos and videos captured by cameras mounted on the spacecraft, giving us breathtaking views of Earth, the Moon, and Orion itself. Finally, there's the scientific data. Orion carries various experiments and sensors to study everything from the deep space radiation environment to the biological impact of long-duration spaceflight. For example, Artemis I carried experiments to measure radiation exposure, which is critical for planning how to keep future crews safe.
Your Mission Control: Where to Find the Data
NASA has made a significant effort to make Artemis mission data accessible to the public, moving beyond static reports to offer dynamic, real-time information. The primary hub for the general public is the Artemis Real-time Orbit Website, or AROW. Available on the NASA website and as a mobile app, AROW provides a live visualization of Orion's position, speed, and distance from both Earth and the Moon. It’s the most user-friendly way to follow the mission as it unfolds. For those who want to dig deeper, NASA offers more advanced resources. The agency's Open Data Portal (data.nasa.gov) is a massive catalog of datasets from various missions, though it can require some searching to find specific Artemis files. For developers and data scientists, NASA provides programmatic access through APIs, such as those available from the Jet Propulsion Laboratory (JPL) Horizons system, which offers high-precision trajectory data. This is the same raw data that engineers and scientists use, allowing for sophisticated custom projects and visualizations.
From Numbers to Narrative: How to Start
Diving into raw data can be intimidating, so it’s best to start simple. The AROW website is the perfect entry point. You can scrub through the mission timeline, view key events, and get a feel for the scale of the journey without needing any technical skills. The website even lets you download the spacecraft’s trajectory data, known as an ephemeris, which you can use in other software. For a more hands-on approach, look for the imagery. NASA regularly releases photos and videos, which are often the easiest data to interpret and share. When you're ready for the numbers, focus on a few key telemetry points. Start by tracking basic values like speed and altitude during a specific mission phase, such as a trajectory correction burn. You can often find these highlighted in NASA's mission blogs and social media updates, which provide context for what the numbers actually mean. Don’t try to understand everything at once; pick one system and follow its performance.
The Student Engineer’s Sandbox
For engineering students, Orion's public data is an unparalleled learning resource. It’s a real-world case study in complex systems operating in an extreme environment. The state vectors and telemetry data available through AROW and JPL's APIs are invaluable for those studying orbital mechanics. You can use this data to model Orion's trajectory, verify its path against your own calculations, and understand the practical application of principles you've only seen in textbooks. Data on power consumption versus generation from the European Service Module's solar arrays provides a masterclass in power systems management. Even data on thermal conditions inside the spacecraft can be used to study thermodynamics. By analyzing the data from Artemis I, engineers have already learned valuable lessons that will be applied to future crewed missions, making this data a living document of iterative design and problem-solving in action.