






The Illusion of Front-of-Pack Claims
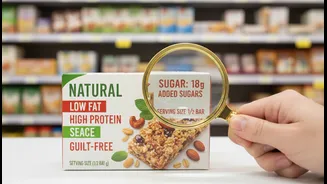
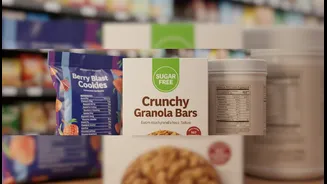
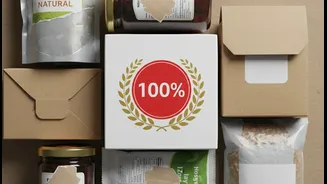
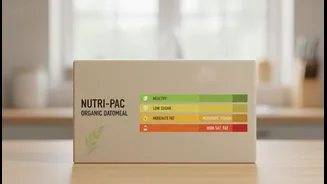
Food packaging is prime real estate for marketing. Brands use bold, appealing claims to make their products seem like the healthiest choice on the shelf. Phrases like "all-natural," "heart-healthy," or "made with whole grains" create a "health halo" around
a product, making us feel good about buying it. However, these claims can be misleading. A 'low-fat' snack might be loaded with sugar and sodium to compensate for taste. Recent actions by the Food Safety and Standards Authority of India (FSSAI) have highlighted this, with notices issued to several companies for using potentially misleading terms like 'healthy' or 'natural' on their packaging. This shows that the front of the packet tells a story the brand wants you to hear, which isn't always the full story.
The Serving Size Deception
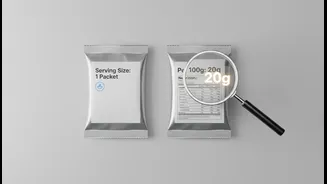
One of the most common ways that nutritional information can be skewed is through the manipulation of serving sizes. A manufacturer might list the nutritional information for an unrealistically small serving. For instance, a packet of biscuits might display calories for a serving of just two biscuits, when most people would eat four or five in one sitting. A bottle of a sweet beverage might show information for a 100ml serving, but the bottle itself contains 300ml. If you consume the whole package, you're actually getting triple the calories, sugar, and fat listed for that single, small serving. This tactic makes the numbers look much more favourable, luring health-conscious consumers into a false sense of security.
Your True Comparison Tool: The 'Per 100g' Column
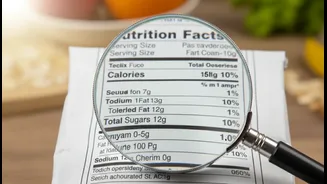
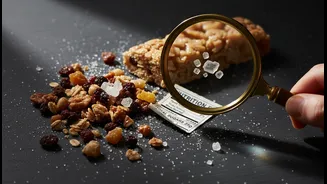
To cut through the confusion, there is one part of the nutrition label that offers a true, like-for-like comparison: the 'per 100g' or 'per 100ml' column. In India, FSSAI regulations mandate that nutritional information be provided in a standardised format, which often includes values per 100g/ml alongside the per-serving information. This is your secret weapon. While one brand of breakfast cereal might define a serving as 30g and another as 45g, the 'per 100g' column puts them on a level playing field. It allows you to ignore the confusing serving sizes and directly compare the amount of sugar, salt, fat, or protein in each product. The product with less sugar or salt per 100g is genuinely the lower-sugar or lower-salt option, regardless of what the front of the packet claims.
A Practical Shopping Guide
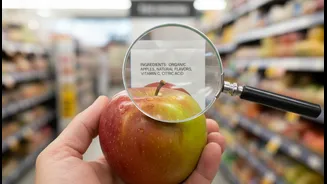
Let's put this into practice. Imagine you're in the juice aisle, trying to choose between two brands of mango juice. Brand A's packet shouts "No Added Sugar!" and its nutrition label is for a 150ml serving. Brand B just looks like a regular juice. Instead of being swayed by Brand A's claim, flip both cartons over to the nutrition panel. First, check the ingredients list—the 'no added sugar' claim on Brand A may be technically true if they have used concentrated fruit juice, which is still a form of sugar. Next, find the 'per 100ml' column for 'Total Sugars'. You might find that Brand A has 12g of sugar per 100ml, while Brand B has only 9g. In this case, the product without the flashy health claim is actually the lower-sugar choice. This simple method works for everything from biscuits and chips to cereals and sauces.
Looking Beyond Just Calories
The 'per 100g' comparison method isn't just for calories and sugar. Use it to compare all the key nutrients. When choosing bread, compare the fibre content per 100g to see which one will keep you fuller for longer. When buying savoury snacks or ready meals, look at the sodium content per 100g to find the option that is kinder to your blood pressure. For products like yogurt or paneer, comparing protein per 100g can help you pick the one that best supports your fitness goals. By consistently using this method, you move from being a passive consumer influenced by marketing to an informed shopper making conscious decisions based on facts.