
The Big Picture from Space
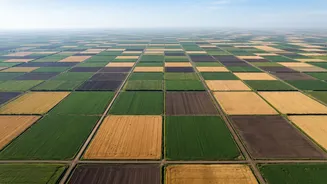
At its core, agricultural satellite imagery is about seeing the unseen. Satellites equipped with advanced sensors capture images of farmland, measuring light that is reflected from the Earth's surface. Crucially, they don't just see visible light like
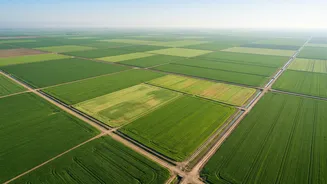
we do; they capture information from other parts of the spectrum, such as near-infrared (NIR) light. Healthy, thriving vegetation reflects NIR light very differently than stressed, diseased, or sparse crops. This difference allows technology to translate raw satellite data into intuitive, color-coded maps that provide a comprehensive overview of an entire farm, highlighting variability that is impossible to see from ground level.
For the Farmer: Precision on the Ground
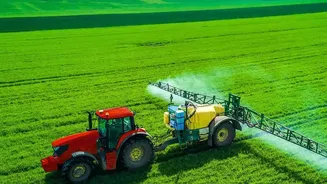
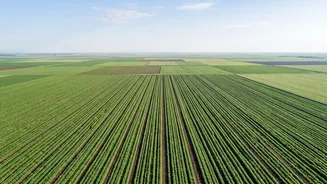
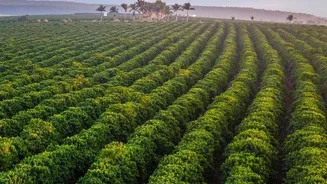
For a farmer, this technology moves decisions from guesswork to evidence. Instead of treating a hundred-acre field as a single, uniform unit, a farmer can see specific zones that are underperforming. These insights have direct, practical applications. For example, satellite data can detect water stress, helping a farmer optimize irrigation and conserve water by targeting only the areas that need it. It can also pinpoint the early stages of a pest infestation or nutrient deficiency, allowing for targeted application of pesticides or fertilizers. This is the essence of precision agriculture: applying the right input, in the right place, at the right time. This not only boosts crop yields and profitability but also reduces waste and minimises environmental impact.
Decoding the Data: Understanding NDVI
One of the most common tools used in satellite farming is the Normalized Difference Vegetation Index, or NDVI. In simple terms, NDVI is a calculation based on the difference between the red light absorbed by plants and the near-infrared light they reflect. The result is a score, typically between -1 and +1, that acts as an indicator of plant health, density, and vigor. On a farm map, high NDVI values (shown as dark green) indicate healthy, dense vegetation, while lower values (often shown in yellow or red) signal stress or bare soil. By tracking NDVI maps over a growing season, a farmer can monitor crop development, see how the crop responds to fertilizers, and detect problems weeks before they become visible to the naked eye.
For the Researcher: A Macro-Level Laboratory
While farmers use satellite data for field-level decisions, researchers use it to answer large-scale questions. In a country like India, where farms can be small and census data is often too broad, remote sensing provides a crucial vantage point. Scientists use satellite imagery to map crop types across vast regions, forecast yields on a national scale, and monitor the impacts of climate events like droughts or floods. For instance, researchers at the University of Michigan have used satellite data in India to identify low-yielding farms and demonstrate how targeted interventions can significantly improve productivity. This macro-level view helps governments and organizations plan for food security, manage resources, and develop policies that support sustainable agriculture.
The Future is Watching
The technology is constantly improving. The resolution of images is getting sharper, and the frequency of satellite passes is increasing, providing ever more timely data. The next frontier involves combining satellite imagery with artificial intelligence (AI) and machine learning. These systems can analyze years of historical satellite data alongside weather patterns and soil information to provide highly accurate predictions and recommendations. While challenges like cloud cover and the cost of high-resolution imagery remain, the trend is clear. Platforms and mobile apps are making these insights more accessible, delivering space-based advice directly into the hands of farmers.