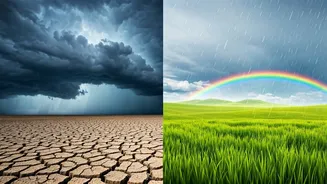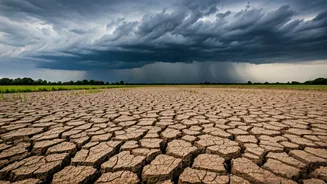


What Has Actually Changed?
The core of the change lies in a crucial metric: the Long Period Average (LPA) of rainfall. The IMD has updated the baseline for calculating the country's monsoon performance. Previously, the LPA was 88 cm, calculated from rainfall data between 1961 and
2010. The new, updated LPA is 87 cm, based on the more recent 50-year period of 1971-2020. While a one-centimetre drop might seem insignificant, it’s a vital adjustment that recalibrates our entire understanding of what constitutes a 'normal' monsoon. It's important to note that this is part of a standard decadal review to keep forecasts relevant, not a sudden reaction to a single year's prediction. This process ensures that our baseline for 'normal' reflects more current climatic trends rather than data from over 60 years ago.
The Long Period Average Explained
Think of the LPA as the country’s monsoon report card average over a long time. The IMD uses this figure as the benchmark to declare if a monsoon is normal, deficient, or in excess. A 'normal' monsoon is defined as rainfall that falls between 96% and 104% of this LPA. Rainfall below 90% is a 'deficient' monsoon, while above 110% is considered 'excess'. By using a 50-year average, the IMD smooths out the natural year-to-year variations and captures a more stable, long-term picture of India's rainfall pattern. Updating this average every ten years is standard scientific practice worldwide, ensuring that our benchmark isn't skewed by outdated climate patterns.
Why Did the IMD Make This Change?
The primary reason is scientific rigour. Climate is not static. Using a rolling, recent 50-year period provides a more accurate picture of the monsoon's behaviour. The previous 1961-2010 dataset included decades that were, on average, wetter. By shifting the window to 1971-2020, the IMD is acknowledging a subtle but persistent drying trend in the all-India summer monsoon rainfall. This downward revision, however small, is a data-driven acknowledgement that the monsoon's character is evolving. It is less a 'reclassification' and more of a 'recalibration' to maintain the accuracy of forecasts, which are critical for agriculture, water management, and economic planning.
What This Means for 'Normal'
With the new LPA at 87 cm, the goalposts for a 'normal' monsoon have shifted slightly. For example, 100% of the LPA is now 87 cm, not 88 cm. Consequently, the threshold for a 'normal' year is now a band around this new, slightly lower figure. This has a psychological and practical effect. A year that might have been classified as 'below normal' under the old system could now just scrape into the 'normal' category. While this doesn't change the amount of rain that actually falls, it changes the official label we put on it. This can influence market sentiment, government response, and public perception of the monsoon's performance.
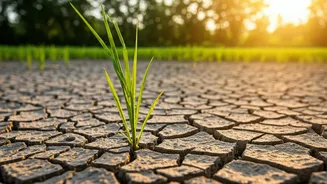
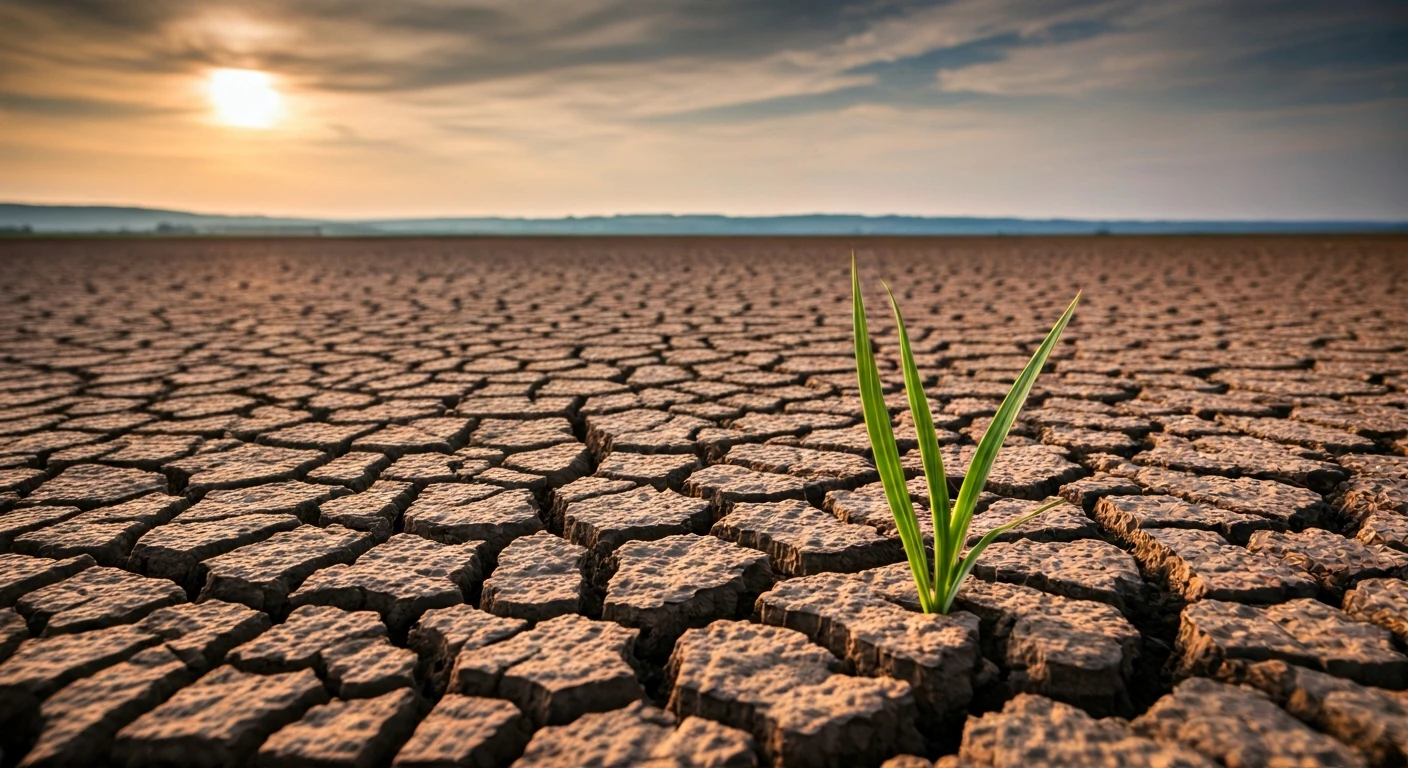
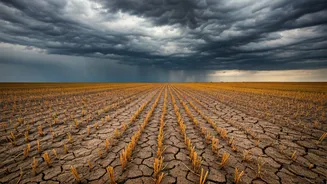
Impact on Farmers and the Economy
For the nearly 50% of India's farmland that is rain-fed, the monsoon forecast is everything. It dictates which crops to plant, when to sow, and how much to invest. The IMD's forecasts, based on the LPA, guide these crucial decisions. A 'below-normal' prediction can prompt farmers to choose more drought-resistant crops or lead to government contingency planning for irrigation and relief. While the statistical definition has been tweaked, the on-ground reality for a farmer remains the same: their fields need a certain amount of water. The new LPA is a sign that the climate they depend on is changing, reinforcing the need for more resilient agricultural practices and better water management strategies to cope with these evolving patterns.