
Seeing the Unseen with Radar
The star player in ISRO's subsurface search is the Dual-Frequency Synthetic Aperture Radar (DFSAR) aboard the Chandrayaan-2 orbiter. Unlike a regular camera that needs light, a SAR instrument creates its own 'vision' by beaming microwave signals down
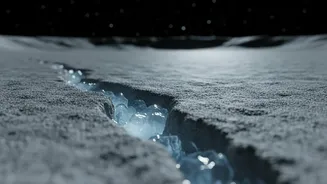
to the surface and analysing the echoes that bounce back. This allows it to see inside permanently shadowed regions (PSRs) near the lunar poles—areas that haven't seen sunlight in billions of years and are some of the coldest places in our solar system. These ultra-cold craters are considered prime locations for preserving water ice. The DFSAR is uniquely powerful because it was the first of its kind to be deployed to study the Moon.
Dual Frequencies for Deeper Insight
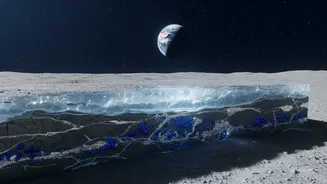
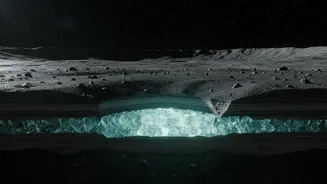
The 'Dual-Frequency' part of DFSAR is its secret weapon. The instrument uses two different microwave bands: S-band and L-band. The higher-frequency S-band provides sharp, high-resolution images of the lunar surface. The lower-frequency L-band, however, is special because its longer wavelength can penetrate through the loose top layer of lunar dust, known as regolith, allowing scientists to probe what lies several meters below. This is crucial for finding ice that isn't exposed on the surface. By comparing the signals from both bands, scientists can distinguish between surface roughness and properties of the material hidden underneath.
How Radar Identifies Ice vs. Rock
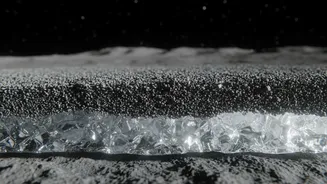
Finding ice isn't as simple as just seeing a bright spot. Both rough, rocky terrain and deposits of ice can scatter radar signals. ISRO scientists use a clever technique involving radar polarimetry to tell them apart. The DFSAR sends out signals with a specific orientation (polarization) and then measures how that orientation changes after bouncing off or through a material. When the signal hits solid rock, it tends to reflect back in a predictable way. But when it hits a deposit of water ice, the signal scatters around within the ice in a process called volumetric scattering. This 'rattling' effect significantly changes the polarization of the returning signal. A recent study highlighted a refined method using two key metrics—a high Circular Polarization Ratio (CPR) and a very low Degree of Polarization (DOP)—as a strong indicator for subsurface ice.
Cross-Verifying with Infrared Vision
While DFSAR is the key to probing the subsurface, ISRO uses a multi-instrument approach to build a stronger case. Another vital tool on the Chandrayaan-2 orbiter is the Imaging Infra-Red Spectrometer (IIRS). This instrument doesn't look under the surface, but instead analyses the sunlight reflected from it. Different materials absorb and reflect light at specific wavelengths. The IIRS is so sensitive it can distinguish the unique spectral signature of water molecules (H₂O) from that of hydroxyl molecules (OH). While Chandrayaan-1 first detected signs of lunar hydration, the advanced IIRS on Chandrayaan-2 was able to confirm and map the presence of actual water molecules, distinguishing between water-rich and drier areas. This surface data helps corroborate the subsurface findings from the radar, creating a more complete picture.
Creating the Final Map
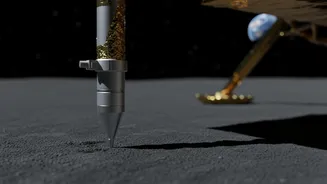
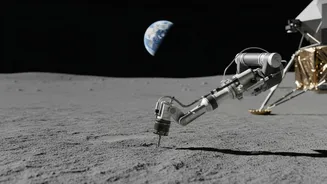
The data from these instruments doesn't arrive as a finished map. It comes as complex datasets of radar reflectivity, polarization values, and spectral readings. Scientists at ISRO and associated labs like the Physical Research Laboratory (PRL) process this information, applying corrections and advanced analysis to translate the raw signals into meaningful evidence. By combining the depth-penetrating view of the DFSAR with the surface composition data from the IIRS, they can create detailed maps that chart not just where water might be, but also whether it's on the surface or buried as thicker sheets of ice. These maps are vital for planning future lunar missions, including ISRO's collaboration on the LUPEX rover mission with Japan, which will aim to drill and directly confirm these icy resources.