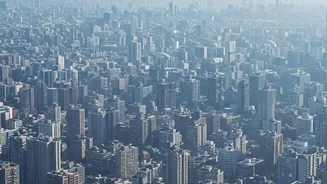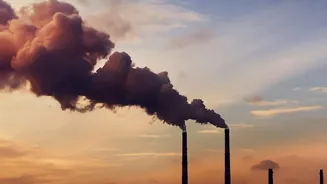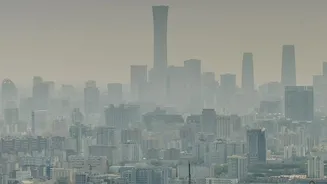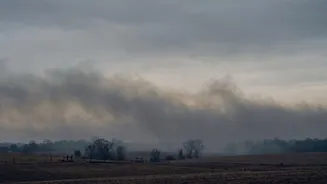





Alarming reports from early November showed Air Quality Index (AQI) readings in Bikaner and Bathinda soaring past hazardous levels. But as these shocking numbers circulate, a crucial question arises: how accurate are they?
The Alarming Numbers on Display
In the first week of November
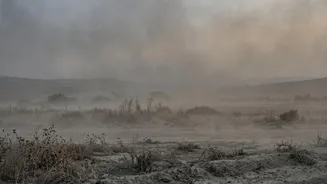
2026, several media outlets and online platforms reported staggering pollution levels across North India. Bikaner in Rajasthan and Bathinda in Punjab were frequently highlighted, with some reports claiming AQI values crossed the 1,000 mark. For context, an AQI above 401 is categorised as 'Severe' on India's official scale, posing a risk of serious respiratory illness. These numbers, showing pollution far exceeding even Delhi's notorious smog, painted a grim picture of a public health emergency.
The All-Important 'Where' and 'When'
The problem with a single, dramatic AQI number is that it often lacks context. Air quality is not static; it can change dramatically from one hour to the next and from one street to another. A reading taken at 3 PM might be vastly different from one at 3 AM. Furthermore, a sensor placed next to a traffic jam, a construction site, or a garbage fire will report much higher pollution than one in a residential park just a kilometre away. Without a precise timestamp and source location, a reported AQI value is just a snapshot without a story. It tells us something happened, but not whether it was a brief spike or a sustained, area-wide crisis.
Official Monitors vs. Crowdsourced Sensors
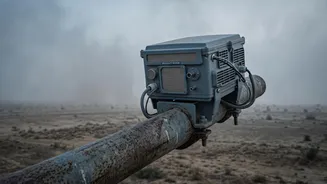
There are primarily two types of air quality monitors in use. The first is the official government network, managed by bodies like the Central Pollution Control Board (CPCB). These are highly accurate, expensive, regularly calibrated stations placed according to strict scientific guidelines. The second type includes a growing number of low-cost, privately-owned sensors that individuals and communities can set up. These are great for providing hyperlocal, real-time trends but can be less reliable. They can be affected by factors like humidity and may not be calibrated correctly, sometimes over-reading pollution levels, especially during smoke events. Often, the most sensational numbers that go viral come from these unverified, low-cost sensors, while official CPCB data may show a different picture.
Why the Numbers Can Differ So Much
Even when using official data, confusion can arise. The AQI is not a direct measurement but a calculated index based on the concentration of several pollutants like PM2.5 and PM10. Different apps and websites might use different averaging times; for instance, a 24-hour average will appear to lag behind a real_time hourly reading. Moreover, the scale itself can vary. The US AQI system, used by many international apps, has different category thresholds than India's National AQI. At moderate pollution levels, the US scale often gives a higher, more alarming number for the same concentration of pollutants.
The Undeniable Regional Crisis
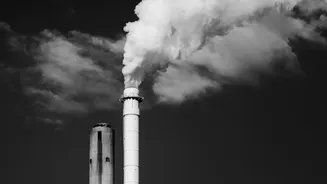
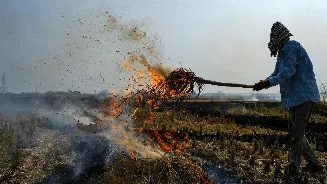
While specific numbers can be debated, the underlying issue is real. Bathinda is one of the districts in Punjab that has seen a high number of stubble_burning incidents this season. This agricultural practice is a major contributor to the thick blanket of smog that descends over the Indo_Gangetic Plain every winter. Unfavourable weather conditions, like low wind speed and falling temperatures, trap these pollutants close to the ground, affecting not just Punjab but also Haryana, Delhi_NCR, and parts of Uttar Pradesh and Rajasthan. The Commission for Air Quality Management (CAQM) has already taken action against officials in Bathinda for failing to control farm fires, underscoring the severity of the situation.