





Beyond a Simple Water Test
Measuring environmental risk in a complex ecosystem like Kerala's is about more than just checking if the water is clear. Researchers are building a complete health profile of the entire system. This means assessing chemical, physical, and biological
dangers. The primary threats come from industrial effluents, agricultural runoff containing pesticides and fertilisers, and untreated sewage from towns and houseboats. These pollutants can deplete oxygen, introduce harmful bacteria, and poison aquatic life, ultimately affecting human health and livelihoods like fishing and farming that depend on these waters.
The Chemical and Physical Toolkit
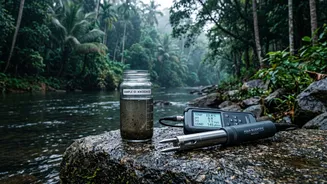
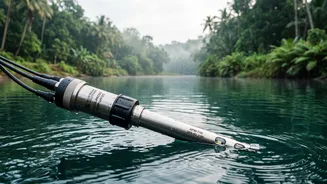
The first step is often direct water sampling. Scientists collect samples from various points along a river or backwater and test them for a wide range of parameters. Standard tests measure pH (acidity), turbidity (cloudiness), and electrical conductivity, which can indicate the presence of dissolved chemicals. More specific analyses look for dangerous pollutants like heavy metals from industrial waste, nitrates and phosphates from agricultural fields, and E. coli bacteria, a clear sign of sewage contamination. In critical areas, like the industrial belt along the Periyar river, authorities have deployed real-time monitoring stations with advanced sensors that continuously track up to 13 different water quality parameters, providing instant alerts.
Using Life as an Indicator
Sometimes, the best way to understand the health of a river is to look at the life within it. This is called biomonitoring. Researchers study benthic macro-invertebrates—small aquatic insects and worms living at the bottom of the water body. The presence or absence of certain species can tell a detailed story. For example, the abundance of pollution-tolerant species like the Chironomus worm can indicate a high degree of organic pollution. Conversely, a thriving and diverse community of different organisms suggests a healthy river. The health and population of fish, the condition of nearby mangroves, and even the types of algae present are all used as biological clues to the water's long-term condition.
A View from Above
To get the bigger picture, researchers are increasingly turning to technology like Geographic Information Systems (GIS) and satellite remote sensing. By combining water quality data from various locations with GIS mapping, scientists can create detailed 'pollution maps'. These maps reveal hotspots, track how pollutants spread, and help policymakers identify specific sources of contamination. Satellite data, especially from platforms like Sentinel-2, allows for monitoring of large areas over time. Researchers can track changes in turbidity, chlorophyll-a (an indicator of algal blooms), and coloured dissolved organic matter (CDOM) across entire backwaters like Vembanad Lake, providing insights that would be impossible to gather from the ground alone.
From Data to Action
This intensive data collection is not just for academic papers. It forms the backbone of environmental management. For instance, the Kerala State Biodiversity Board recently launched India's first state-level Red List Assessment of Ecosystems, a scientific initiative to evaluate the risk of collapse for entire ecosystems using international standards. This data helps create conservation priority maps and empowers local bodies to undertake restoration projects. Real-time data has been crucial in identifying the causes of fish kills and taking timely action against polluters. By combining on-the-ground sampling, biological analysis, and high-tech mapping, researchers provide the critical evidence needed to protect Kerala’s invaluable water heritage for the future.