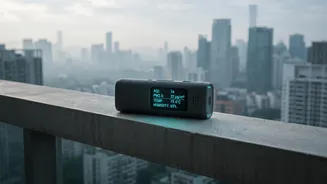







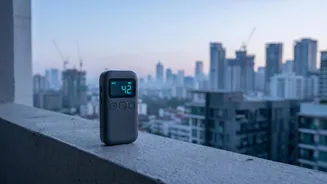

As concerns over air quality grow in India's cities, checking the Air Quality Index (AQI) is becoming a daily ritual. But with various apps and websites, how do you know which to trust? Here are simple ways to get a reliable reading.
First, Understand the AQI Scale
The Air Quality Index,
or AQI, is a tool used to communicate how polluted the air currently is. Launched in India in 2014 by the Central Pollution Control Board (CPCB), it simplifies complex data into a single number, a colour, and a one-line description. The scale runs from 0 to 500 and is divided into six categories: 'Good' (0-50), 'Satisfactory' (51-100), 'Moderate' (101-200), 'Poor' (201-300), 'Very Poor' (301-400), and 'Severe' (401-500). A higher number means greater pollution and a more significant health risk. This index is calculated based on eight major pollutants, including PM2.5 and PM10, which are fine dust and smoke particles that pose the greatest health threats.
Start with Official Government Sources
For the most authoritative data, turn to official government platforms. The CPCB's own app, 'Sameer', pulls data directly from the national network of air quality monitoring stations, making it a reliable benchmark. Another key resource is SAFAR (System of Air Quality and Weather Forecasting and Research), an initiative by the Ministry of Earth Sciences. The SAFAR-Air app and website provide real-time data and forecasts, primarily for major metro areas like Delhi, Mumbai, Pune, and Ahmedabad. These government sources provide the same data used for official health advisories and policy decisions, like the Graded Response Action Plan (GRAP) in Delhi-NCR.
Use Reputable Third-Party Apps
A variety of thirdparty apps offer userfriendly ways to check AQI, often with added features like forecasts and health advice. IQAir's AirVisual is a popular global choice with extensive coverage in India, offering detailed data and historical trends. Another strong option is AQI.in, praised for its hyperlocal readings at the neighbourhood level. Many standard weather apps, including AccuWeather and even Google Maps, now integrate AQI data, providing a convenient snapshot alongside the weather forecast. For those with specific health concerns, Ambee tracks both air quality and pollen levels, which is useful for individuals with allergies or asthma.
Why Different Apps Show Different Numbers
You might notice that two different apps can show two different AQI scores for the same location at the same time. This is normal and happens for several reasons. Apps may pull data from different sources—some use official government monitors, while others rely on their own sensor networks or crowdsourced data. They might also use different update frequencies or averaging times; for example, one app might show a 24hour average while another gives an instantaneous reading. Furthermore, some apps may measure a different primary pollutant. Because of these variables, it's wise to crossreference between a government source like Sameer and a trusted thirdparty app to get a more complete picture of the air quality around you.
Look and Listen to Your Body
While apps and websites provide precise numbers, your own senses can offer valuable clues, especially when a monitor isn't nearby. Visibly hazy or smoggy skies are a clear indicator of poor air quality. Reduced visibility, where distant buildings or landmarks are obscured, suggests a high concentration of particulate matter. Pay attention to physical symptoms as well. An increase in coughing, a scratchy throat, irritated eyes, or shortness of breath upon exertion can all be signs that the air quality is poor. While not a substitute for a measured AQI score, these realworld observations can be a helpful, immediate prompt to take precautions, such as limiting strenuous outdoor activity or wearing a mask.