








The Annual Data Deluge
Every year, the Centre for Science and Environment (CSE) releases its comprehensive 'State of India's Environment' report, an essential snapshot of the nation's ecological health. The 2026 edition highlights several critical pressure points: 2025 was
the worst year in the last four for extreme weather events, human-tiger conflict is rising as habitats shrink, and huge gaps persist in air pollution monitoring across the country. Headlines often scream about these findings, painting a picture of uniform doom. While the challenges are immense and backed by data, understanding them requires looking deeper than the initial shock value.
Tip 1: Look Beyond the Headline Number
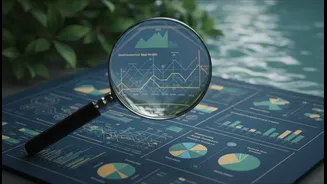
A single statistic can be powerful but also misleading. For instance, the 2026 report notes that in 2025, India experienced extreme weather on 99% of days between January and November. That sounds apocalyptic. But a critical reader asks for context. How does this compare to previous years? The report shows a trend: the number of days with extreme weather was 88% in 2024 and 89% in 2023. The single number (99%) is alarming, but the trend (a steady, alarming increase) is the more useful story for understanding climate impact. Always look for trends over time, regional variations (Himachal Pradesh was worst-hit), and comparative data rather than accepting a standalone number at face value.
Tip 2: Question the Gaps in the Data
What is not measured is often as important as what is. The 2026 report reveals a stark inequality in environmental monitoring. Only 15% of India's population lives within 10 kilometres of a real-time air quality monitor. This means for 85% of people, particularly in smaller towns and industrial belts, the air they breathe is officially unmeasured. So, when a report discusses national air quality averages, remember that this picture is assembled from limited data points, mostly in large cities. This doesn't mean the data is useless, but it shows that the reality in unmonitored areas could be significantly different—and potentially worse. A healthy dose of scepticism about the completeness of data is crucial.
Tip 3: Watch for Words of Hype vs. Fact
The language used to describe environmental issues matters. Reports from scientific bodies like the CSE tend to use measured, specific language. They talk about 'widening ecological backlash' and the world being 'close to breaching the 1.5°C global warming threshold'. In contrast, media reports or activist campaigns might use words like 'catastrophe', 'eco-pocalypse', or 'miracle solution'. Another form of hype is 'greenwashing', where companies make misleading environmental claims. For instance, a product advertised as 'CFC-free' is making a meaningless claim, since CFCs have been banned for decades. Be wary of vague terms like 'eco-friendly' or 'natural' without specific, verifiable proof.
Tip 4: Connect the Dots to Find the Real Story
The most powerful insights come from connecting different data points. The 2026 report highlights a rise in human-tiger conflict, with dozens of deaths reported near reserves in 2025. This isn't just about tigers becoming more aggressive. The report also notes that tiger territories now overlap with land inhabited by 60 million people and that an invasive plant, Lantana camara, is overrunning forests, reducing natural prey for tigers. Suddenly, the story is not just 'dangerous tigers' but a complex issue of habitat loss, invasive species, and population pressure. By linking these facts, you move from a sensational headline to a nuanced understanding of a systemic problem, which is the first step toward finding a real solution.