








The Concrete Jungle's Fever
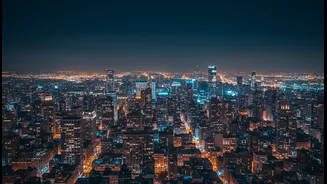
Cities across India are becoming significantly hotter than their surrounding rural areas, a phenomenon known as the Urban Heat Island (UHI) effect. Materials like concrete, asphalt, and dark roofing absorb immense solar radiation during the day. Unlike
natural landscapes with soil and vegetation, which cool down by releasing moisture, these man-made surfaces retain heat and slowly radiate it back into the atmosphere long after sunset. This process turns densely packed neighbourhoods into heat traps. Studies show this can make urban cores several degrees warmer than nearby vegetated areas, exacerbating heatwaves and creating a public health crisis.
Why Midnight Matters Most
While daytime temperatures grab headlines, the real danger often lurks after dark. A lack of nighttime cooling is particularly stressful for the human body, preventing it from recovering from the heat of the day. This relentless exposure can worsen conditions like hypertension and diabetes, and increase the risk of heat exhaustion and heatstroke. Research in Indian cities like Delhi has found that nighttime temperatures in densely built areas can be 2-6°C higher than in greener surroundings. This turns homes, especially those with poor ventilation or insulation in low-income areas, into dangerous heat traps, robbing residents of essential rest and recovery.
Eyes in the Sky, Sensors on the Ground
To pinpoint these hazardous zones, scientists and city planners are employing multi-faceted tracking methods. The primary tool is satellite remote sensing. Satellites like Landsat and MODIS measure Land Surface Temperature (LST) by detecting thermal infrared radiation from the Earth's surface. This provides a comprehensive, city-wide view of which surfaces are emitting the most heat. By analysing this data over time, researchers can identify consistent hotspots, often corresponding to industrial zones, commercial districts, and dense residential areas with minimal green space. This high-level data is then complemented by ground-level sensors that provide real-time air temperature and humidity readings, offering a more complete picture of the heat residents actually experience.
Mapping the Most Vulnerable Areas
The data collected from satellites and ground sensors is used to create detailed heat vulnerability maps. These maps do more than just show temperature; they overlay heat data with socioeconomic information, such as population density, income levels, and the locations of vulnerable groups like the elderly and young children. This allows officials to identify not just where the city is hottest, but who is most at risk. For example, a neighbourhood with high LST, dense housing, and a large elderly population would be flagged as a priority for intervention. This granular, evidence-based approach is crucial for moving beyond broad warnings and implementing targeted, life-saving measures.
From Data to Cooler, Greener Design
Identifying heat zones is only the first step; the ultimate goal is to cool them down. The data from climate tracking directly informs urban planning and policy. Armed with these heat maps, cities can implement a range of nature-based solutions. Strategies include launching massive tree-planting initiatives to increase shade and evaporative cooling, and creating new parks and green corridors. Other interventions focus on infrastructure, such as promoting 'cool roofs'—using reflective paint or materials that absorb less heat—which can lower indoor temperatures significantly. Planners can also push for the use of permeable pavements that allow water to filter through and cool the ground, and restore urban water bodies that act as natural air conditioners for their surroundings.