







What the National Data Shows
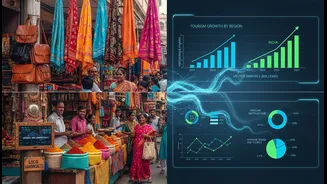
The India Tourism Data Portal, managed by the Ministry of Tourism, is a powerful tool for understanding the broad strokes of travel in the country. It aggregates data from various sources to provide statistics on foreign tourist arrivals (FTAs), domestic
tourist visits (DTVs), and foreign exchange earnings. This information is invaluable for spotting macro trends, such as which states are most visited overall, the growth of tourism year-on-year, and the economic impact of the sector. For researchers, policymakers, and businesses, these national-level statistics offer a comprehensive overview of the industry's health and trajectory. For a traveller, it can help answer big questions like how popular India is as a destination or which months constitute the peak season on a national scale.
The Gap Between National and Local Reality
The primary limitation of this bird's-eye-view data is that it smooths over critical local variations. A state like Himachal Pradesh might show steady visitor numbers at a national level, but this data won't tell you that a specific valley is inaccessible due to a landslide, or that one popular town like Manali is experiencing extreme over-tourism during a long weekend, while another remains quiet. Similarly, national data on seasonal travel can be misleading. While the monsoon season (June to September) is broadly considered the low season for most of India, it is the absolute best time to visit the high-altitude deserts of Ladakh. Relying solely on aggregated numbers means you might miss hyper-local events, weather disruptions, road closures, or sudden price surges that can significantly impact your travel plans.
Why This Discrepancy Exists
This data gap isn't intentional but is a result of how statistics are compiled. Official tourism data often has a significant reporting lag of several months to over a year. Information is collected from states, immigration offices, and other bodies, then aggregated, a process that takes time. This means the data you're seeing might be from the previous year, unable to reflect current events. Furthermore, the very definition of a 'tourist' can vary, and data collection might not distinguish between a business traveller, someone visiting family, and a leisure tourist, which can skew the perception of tourist activity in a specific region. The goal of national statistics is to provide a consistent, historical overview, not a live, on-the-ground report, which is what travellers truly need.
Your Toolkit for Hyper-Local Insights
To get a truly accurate picture, you need to supplement the national data with more dynamic, local sources. Start with the official tourism websites of the specific states you plan to visit, as they often have more targeted updates. For real-time conditions, nothing beats local intelligence. Check recent travel blogs, YouTube vlogs, or social media posts from your destination; searching by location tags on Instagram can reveal what a place looks like right now. Online travel forums and communities are also invaluable for asking specific questions of people who have just returned. For road travel, apps like Google Maps provide live traffic data, including closures and disruptions, sourced from traffic authorities and users. Combining these sources gives you a far more granular and reliable view.