




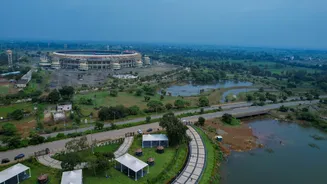
The Unblinking Eye on Urban Sprawl
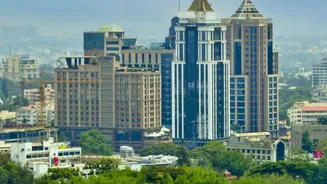
One of the most direct applications of satellite imagery is tracking the physical expansion of cities. By comparing images taken over months and years, planners can see precisely where agricultural land, forests, and wetlands are being converted into
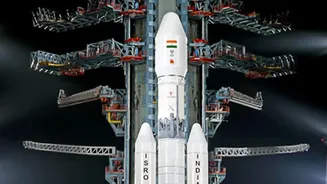
built-up areas. This 'change detection' is no longer a slow, manual process. High-resolution data from ISRO's satellites like Cartosat and global missions like Landsat allow authorities to monitor urban sprawl in near real-time. For instance, studies have quantified how cities like Hyderabad, Bengaluru, and Pune have expanded by dozens of square kilometres, often faster than official records can track. This data is crucial for identifying unauthorised construction and understanding how cities grow, enabling urban local bodies to plan for essential services like water, sanitation, and roads more effectively.
Following the Lights to Track the Economy
When the sun sets, another story of urban growth unfolds. Satellites equipped with sensors like the Visible Infrared Imaging Radiometer Suite (VIIRS) capture the brightness of city lights at night. This 'night-time light' (NTL) data serves as a powerful proxy for economic activity, population density, and development. According to an ISRO report, India's overall night-time brightness increased by 43% in a decade, with some states seeing a jump of over 400%. Researchers have found a strong correlation between NTL data and district-level GDP. More than just measuring growth, the patterns of light can also reveal economic inequality. Stark differences between brightly lit and dim parts of a city can signal unequal access to resources, and some studies have even linked this light-based inequality to higher crime rates.
Monitoring the Urban Environmental Toll
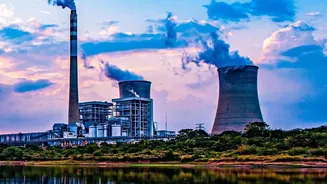
Rapid urbanisation often comes at an environmental cost, and satellites are uniquely positioned to measure it. Thermal sensors can map Land Surface Temperatures, revealing the 'Urban Heat Island' (UHI) effect, where concrete and asphalt make cities significantly hotter than their surrounding rural areas. Studies show that between 2003 and 2020, India's cities warmed at double the rate of the rest of the country. In some cities, the loss of green cover and water bodies has led to temperature rises of several degrees Celsius. Satellites also monitor air quality by measuring pollutants like nitrogen dioxide (NO₂) and fine particulate matter (PM2.5). This data helps identify pollution hotspots, track sources like industrial emissions or stubble burning, and create more comprehensive air quality maps that go beyond ground-based monitors, which are often concentrated in urban centres.
A Blueprint for Smarter Cities
Ultimately, the value of satellite data lies in its application. It is not just about observing problems but actively solving them. Indian space agency ISRO works with government bodies to use this data for better urban governance under missions like the Atal Mission for Rejuvenation and Urban Transformation (AMRUT). High-resolution land use and land cover (LULC) maps provide a detailed inventory of a city's assets—from parks and water bodies to residential and industrial zones. This information helps planners make evidence-based decisions: where to route new public transport, which areas need more green spaces to mitigate heat, and how to manage water resources. By providing a consistent, large-scale, and frequently updated view of the urban landscape, satellite data empowers authorities to move from reactive fixes to proactive, sustainable planning for the future.