


The ‘Painless’ Problem of Digital Spending
Handing over physical cash creates a tangible sense of loss known as the “pain of paying”. This friction acts as a natural psychological brake on spending. Digital payments, especially the seamless QR code scans of UPI, remove this friction almost entirely.
The transaction feels abstract and effortless, creating a disconnect from the financial consequences. Studies have shown that people are willing to spend significantly more when not using cash because the payment feels less ‘real’. This phenomenon, sometimes called the 'cashless effect', makes it incredibly easy to overspend without noticing. A ₹100 payment here and a ₹200 payment there don't feel significant in the moment, but they accumulate rapidly, leading to the common feeling of money disappearing by the end of the month.
Your UPI History: An Unbiased Financial Diary
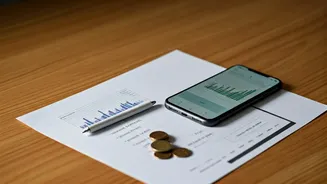
While UPI makes it easy to lose track, it also creates a powerful, unintended benefit: a perfect, real-time ledger of your spending. Unlike cash, every UPI transaction is automatically recorded with a date, amount, and recipient. Your UPI app's history (whether on Google Pay, PhonePe, Paytm, or your banking app) is the most accurate story of your financial life. Instead of viewing this history with dread, see it as the raw data you need for effective budgeting. It is an honest, emotion-free record of where your money actually goes, from utility bills to impulse buys. This detailed log is the essential first step to understanding your habits before you can change them.
Step 1: Consolidate and Categorise Your Spending
The first actionable step is to review your transaction history. Don’t wait for the first of the month; start with the last 30 days to get an immediate baseline. Go through the history in your primary UPI app(s). As you review each expense, group it into a simple category. You can do this manually with a notebook or a spreadsheet. Common categories include: * **Essentials:** Groceries, Rent, Utilities, Commute * **Lifestyle:** Dining Out, Shopping, Entertainment, Subscriptions * **Financial:** EMI payments, Investments, Loan Repayments * **Miscellaneous:** One-off purchases, Gifts The goal isn’t to judge your past spending but simply to see the patterns. You might be surprised by how much goes towards a single category like food delivery or online shopping.
Step 2: From Data to a Simple Budget
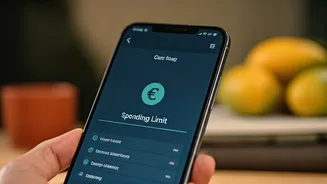
Once you have categorised a month's worth of UPI spending, you have the foundation for a budget. This data shows you the reality of your cash flow. Now, you can set realistic goals. A popular and simple framework is the 50/30/20 rule, where you allocate 50% of your income to needs (essentials), 30% to wants (lifestyle), and 20% to savings and debt repayment. By comparing your tracked UPI spending against these percentages, you can immediately identify where you are overspending. If your ‘wants’ are taking up 50% of your income, you know exactly where you need to make adjustments. Your UPI data turns budgeting from a guessing game into an informed plan.
Automating the Process with Expense Tracker Apps
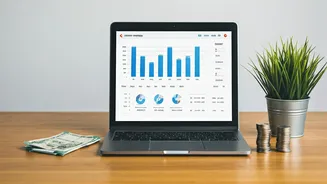
While manual tracking is effective, several apps in India can automate this process. Some apps work by reading your transactional SMS alerts, automatically categorising every UPI, card, and bank transaction without manual entry. Others offer in-app insights within the UPI apps themselves, though this only covers payments made through that specific app. There are also manual and AI-assisted entry apps that provide more control. Using an expense tracker can provide visual dashboards, show spending trends over time, and help you set and monitor category-specific budgets, making the entire process more efficient.