
Satellite Images: A Raw Snapshot
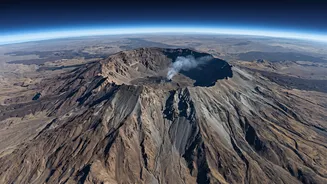
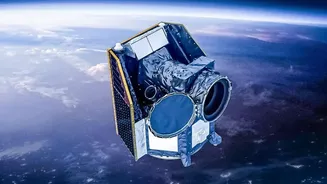
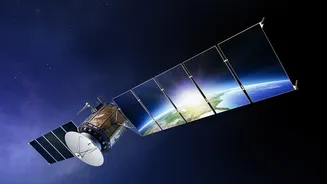
A satellite image is essentially a photograph of Earth taken from space. Think of it as the raw ingredient. Satellites orbiting our planet are equipped with advanced sensors that capture electromagnetic radiation reflected or emitted from the Earth's
surface. This isn't limited to the visible light our eyes see; it can include infrared and other spectral bands, each revealing different information about features like vegetation health, soil moisture, or temperature. The result is a digital file composed of pixels, where each pixel has a value corresponding to the data captured for that specific point on the ground. These images are a direct, unprocessed record of a place at a particular moment in time—clouds and all. They are incredibly valuable for analysis, like monitoring deforestation, assessing disaster damage, or tracking weather patterns.
Satellite Maps: The Interpreted Tool
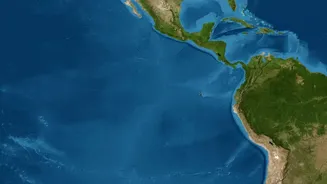
A satellite map, like the one you use for navigation, is a highly processed product created from satellite images and other data. If the image is the raw ingredient, the map is the finished meal. A map is a composite, often stitched together from multiple images taken on different, cloud-free days to create a seamless and visually consistent view. But it's more than just a pretty picture. A map is designed for interaction and provides selected, useful information. The key difference lies in the data structure. While images are made of pixels (a format called raster data), maps often represent features like roads, buildings, and boundaries as points, lines, and polygons (known as vector data). This makes the map searchable, scalable, and useful for tasks like calculating a route or finding a specific address.
From Image to Map: The Transformation Process
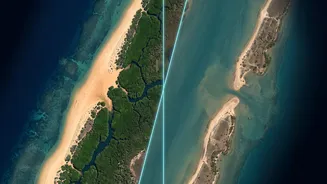
Turning a collection of raw satellite images into a user-friendly map is a complex process called geospatial data processing. First, the raw images must be corrected. This involves removing distortions caused by the satellite's movement, the Earth's curvature, and atmospheric haze. This step, known as orthorectification, ensures the image aligns perfectly with geographic coordinates on the ground. Next, multiple images are stitched together and colour-balanced to create a seamless mosaic. To create the interactive elements of a map, cartographers and algorithms perform 'feature extraction'. They identify and trace objects in the imagery, converting them into vector data. A road becomes a line, a building becomes a polygon, and a restaurant becomes a point. These vector layers are then placed on top of the base imagery, creating the rich, layered experience we use every day.
Why the Distinction Matters: Different Tools for Different Jobs
Understanding the difference helps clarify why each is used for specific tasks. You need raw satellite imagery for analysis that requires a true-to-the-moment snapshot. Environmental scientists use it to see the actual extent of a flood or the health of a crop at a specific time. Emergency responders use it to assess damage after a natural disaster because it shows what's truly on the ground. On the other hand, you need a satellite map for navigation and planning. When you ask your phone for the quickest route to work, it's querying vector data representing roads to calculate the optimal path—a task impossible with a simple image file. Urban planners use satellite maps to analyze zoning boundaries (polygons) and infrastructure networks (lines), while logistics companies use them to optimize delivery routes. The map gives you curated information, while the image gives you unfiltered reality.