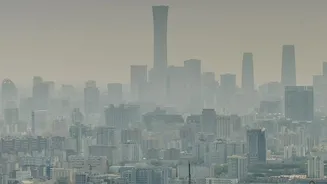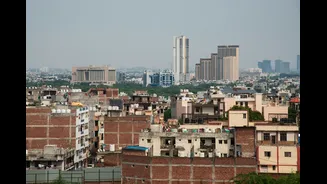





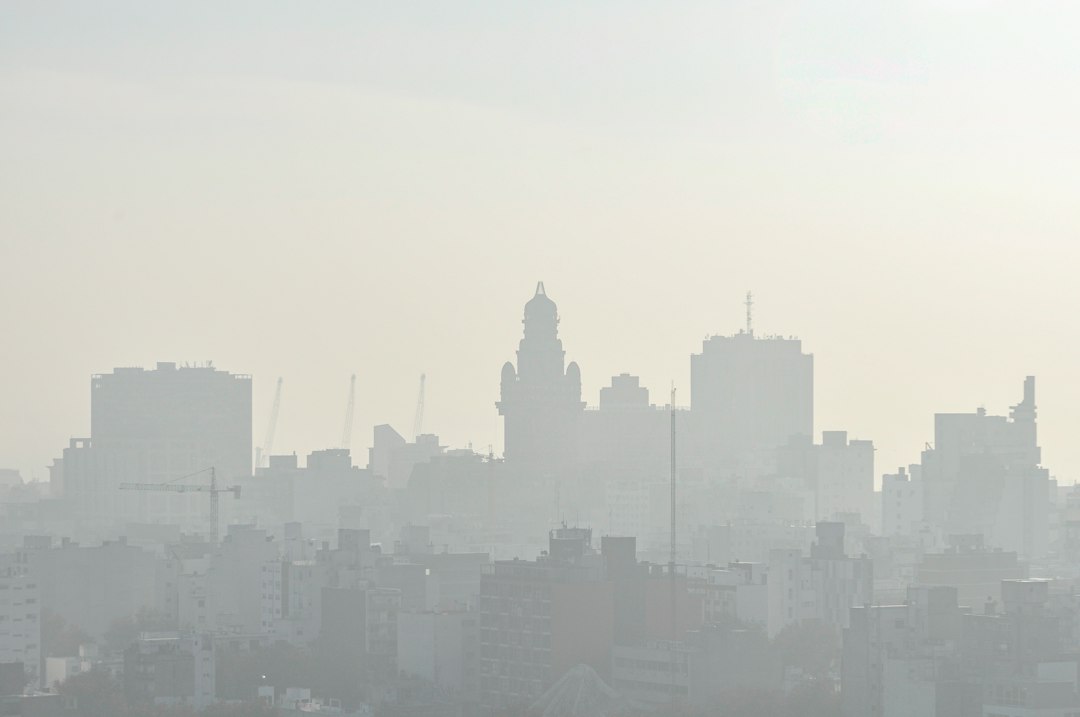


In early November, headlines declared Rajasthan's Bikaner the most polluted city in India, with a shocking Air Quality Index (AQI) of 1,357, while Punjab's Bathinda was not far behind. But what do these staggering numbers truly mean?
The Alarming Numbers
On November 4, 2026,
reports emerged showing Bikaner's AQI soaring to an astonishing 1,357, with Bathinda recording levels as high as 883. To put that in perspective, India's official National Air Quality Index (NAQI) categorises any reading above 401 as 'Severe'. These figures, published by some news outlets and circulating on social media, painted a grim picture of an air quality crisis extending far beyond the usual focus on Delhi. However, these numbers also raised a critical question: where were they coming from, and could they be trusted?
Official vs. Unofficial Data
The key to understanding these figures lies in the difference between official and unofficial sources. Official air quality data in India is provided by the Central Pollution Control Board (CPCB), which uses a network of sophisticated, regularly calibrated monitoring stations. These stations use high-end equipment, like Beta Attenuation Monitors (BAMs), which are considered reference-grade for regulatory purposes. In contrast, many of the dramatic, four-digit AQI numbers come from private platforms and low-cost sensors. These sensors, which often use laser-scattering technology, can be purchased and installed by individuals, creating a dense, hyperlocal network of data points. While they offer real-time readings, their accuracy can be a concern as they are not regulated or standardised in the same way as government monitors.
Why the Scale Matters
The problem isn't just about the source of the data but also the scale used to interpret it. India's official NAQI system has a crucial feature: it is capped at 500. No matter how high the concentration of pollutants gets, the official AQI will never report a number above 500. In contrast, many international platforms and apps use the U.S. Environmental Protection Agency (EPA) scale, which is uncapped and can run much higher. This is why a private app might show an AQI of 1,500 while an official CPCB monitor nearby reports 500, even if they are measuring the same dangerously polluted air. The underlying pollution is the same, but the index—the language used to describe it—is different. This discrepancy can cause significant public confusion and debate over which figure is 'correct'.
The Bigger Picture: A Call for Clarity
The capping of India's official index at 500 is a point of contention. Critics argue that it downplays the severity of extreme pollution events, where the actual health risk continues to climb even if the number doesn't. An uncapped scale, like the one used by the U.S. EPA, can better communicate the true magnitude of the hazard when pollution reaches catastrophic levels. The extreme readings from Bikaner and Bathinda highlight a broader issue: a lack of standardisation and transparency in how air quality is reported. Without knowing the source of the monitor and the scale being used, a raw AQI number can be more alarming than informative. It underscores the need for better data literacy among the public and clearer communication from all platforms reporting air quality.