


The Engine Room: Indian Ocean Ridges
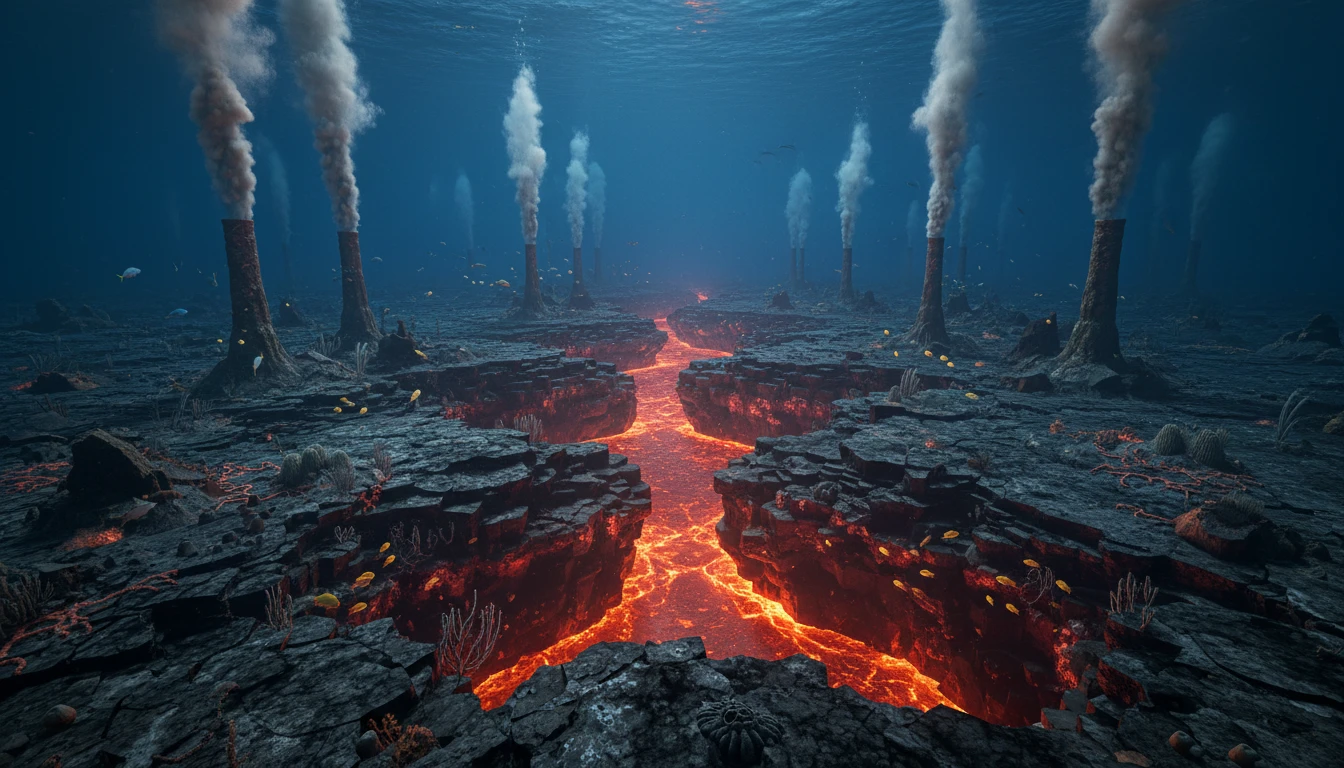
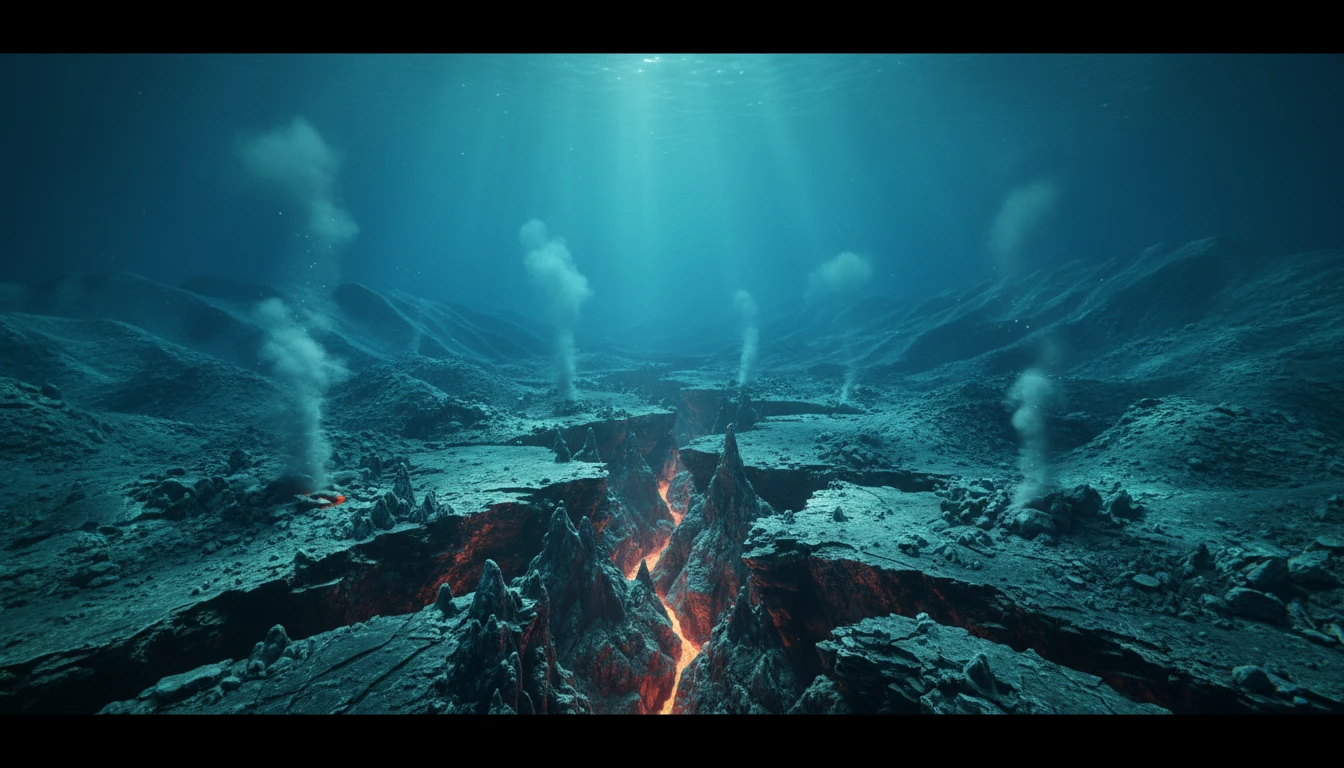
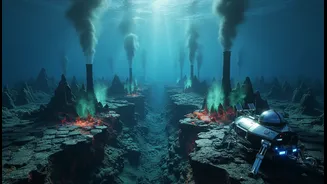
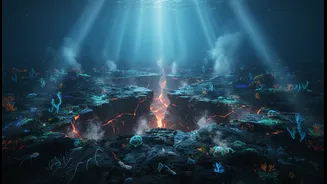
Seafloor spreading is the fundamental process where tectonic plates pull apart, allowing magma from the mantle to rise, cool, and form new oceanic crust. The Indian Ocean is a hotbed for this activity, primarily along a massive underwater mountain chain.
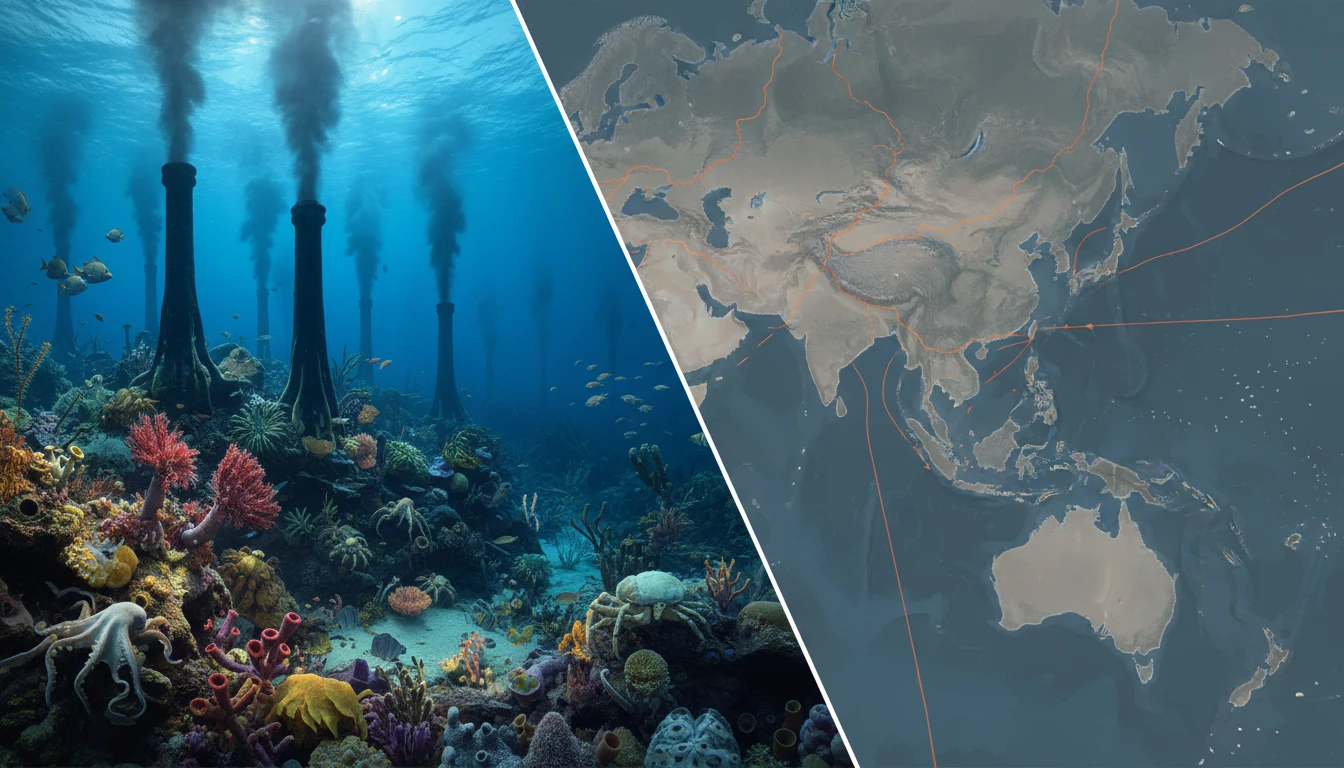
This system includes the Central Indian Ridge (CIR), Carlsberg Ridge, Southwest Indian Ridge (SWIR), and Southeast Indian Ridge (SEIR). These ridges are the boundaries where the African, Indian, Australian, and Antarctic plates diverge. The CIR, for instance, is a slow-to-intermediate spreading ridge, creating new seafloor at a rate of about 30 to 50 millimetres per year. This constant creation pushes the Indian Plate northwards, a journey that famously resulted in its collision with the Eurasian Plate and the formation of the Himalayas.
Finding Today’s Seafloor: Live Data
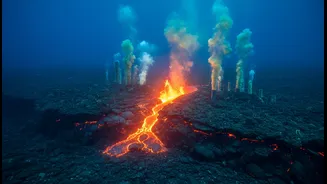
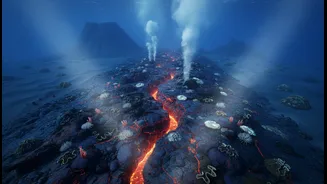
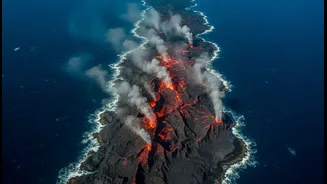
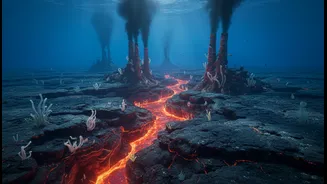
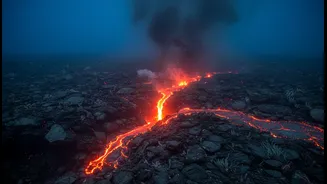
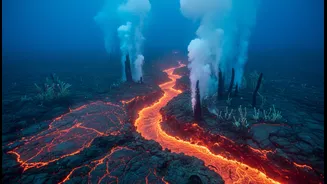
To see the seafloor as it is today, your best resource is bathymetric data, which is essentially a map of the ocean floor's topography. The General Bathymetric Chart of the Oceans (GEBCO) is a key public resource. Its global grid combines data from ship-based sonar and satellite measurements. You can access GEBCO data through their website, which offers downloadable grids and web map services that can be used in Geographic Information System (GIS) software. Another major source is the U.S. National Oceanic and Atmospheric Administration (NOAA), which archives and provides vast amounts of bathymetric data, including from multibeam sonar that gives detailed views of the seafloor. Recently, scientists have even been able to capture seafloor spreading events in near real-time using advanced underwater observatories, witnessing massive lava flows and crustal stretching along the Southeast Indian Ridge.
A Journey to the Past: Geological Reconstructions
To compare the present with the past, you need to access geological reconstructions. These are not pictures, but sophisticated models built from evidence like magnetic anomalies on the seafloor, the age of oceanic crust, and the geology of continents. The premier tool for this is GPlates, a free, open-source desktop software developed by an international team of scientists. GPlates allows you to load geological and geophysical data and visualize how plates have moved and continents have drifted over millions of years. You can download pre-made reconstruction models, including those that detail the breakup of the supercontinent Gondwana and the subsequent northward race of the Indian plate. These models let you literally rewind geological time to see where the Indian subcontinent was 50, 100, or even 200 million years ago.
Making the Comparison: Past Meets Present
With tools to see both the present-day seafloor and its past configurations, you can now make a direct comparison. Using a program like GPlates or a GIS platform, you can overlay modern bathymetric data from GEBCO or NOAA onto a plate reconstruction from a specific time, for example, 60 million years ago. You can observe the ancient position of the Indian plate and trace its path northward along the trail left by the mid-ocean ridges. Look at the magnetic stripes in today's seafloor data; these are symmetrical patterns on either side of a ridge that act as a geological tape recorder, showing the history of spreading. Compare the current spreading rate of the Central Indian Ridge with the reconstructed velocity of the Indian plate's past movement—at times, it moved exceptionally fast. This comparison allows you to see how the active ridges of today are the direct continuation of the forces that have shaped the Indian subcontinent for eons.
What This Tells Us About Our World
Comparing live data with historical models does more than just satisfy curiosity; it vividly confirms the theory of plate tectonics. It shows that the dramatic geology of the Indian subcontinent—from the towering Himalayas to the seismic activity across the region—is the result of an ongoing, long-term process. You can see how the Indian plate's rapid northward sprint, powered by seafloor spreading, led to the monumental continental collision that is still unfolding today. These observations also help scientists understand earthquake risks and the processes that form valuable mineral deposits on the ocean floor. By exploring these datasets, you are not just looking at maps; you are witnessing the deep, dynamic history of the very ground beneath India. The forces that created new oceans millions of years ago are still at work, continuously reshaping our planet.