







You check your phone for the air quality, and one app says 'Severe' while another says 'Hazardous'. It’s a common confusion, highlighted recently when Bikaner and Bathinda saw shocking pollution readings that seemed to vary by source.
The Bikaner and Bathinda Story
In early November,
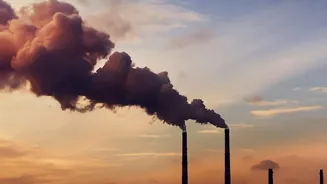
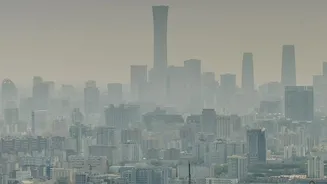
cities like Bikaner in Rajasthan and Bathinda in Punjab made headlines for recording extreme Air Quality Index (AQI) values, with some real-time trackers showing numbers soaring past 1,000. These figures, deep into the 'Hazardous' territory, signal an emergency. The crisis was driven by a combination of stubble burning, industrial emissions, and meteorological conditions that trapped pollutants. However, residents checking different apps and websites might have noticed a confusing array of numbers for the same locations, sparking the question: who is right?
Official vs. Commercial Sensors
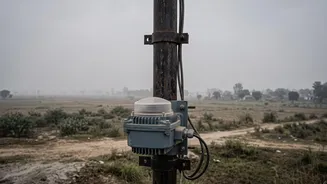
A major reason for disagreement lies in the hardware itself. Official government monitors, like those used by the Central Pollution Control Board (CPCB), are highly accurate, robust, and expensive. They often use methods like beta attenuation to measure particulate matter precisely. In contrast, many popular commercial apps and personal devices rely on data from networks of low-cost sensors. These often use a light-scattering technique, where a laser estimates particle concentration. While incredibly useful for providing hyperlocal data, these sensors are more susceptible to errors caused by environmental factors. The CPCB itself notes that the accuracy of these low-cost sensors is not yet fully established for regulatory use.
Location Makes All the Difference
An AQI reading is only representative of the air where the monitor is located. India needs an estimated 4,000 monitoring stations for full coverage but currently has around 800 official ones. A single monitor in a large city like Bathinda may not capture the full picture. If that monitor is placed in a green, residential area, it will report better air quality than a sensor located next to a high-traffic intersection or an industrial zone. Commercial sensor networks often have more data points, offering street-level granularity, but each sensor's immediate environment heavily influences its reading.
The Problem with Humidity
Environmental conditions can significantly interfere with sensor accuracy, especially for the optical sensors common in cheaper devices. High humidity is a major culprit. Water vapor can cause particulate matter to swell, a process called hygroscopic growth. This makes the sensor 'see' small, less harmful particles as larger, more dangerous ones, leading to an artificially high PM2.5 reading—sometimes inflated by a significant margin. Temperature fluctuations can also cause sensor materials to drift, affecting accuracy and requiring frequent calibration.
What Is Actually Being Measured?
The AQI is not a direct measurement of one thing; it's a calculated index. In India, the official AQI can be based on eight different pollutants, including PM2.5, PM10, ozone, and nitrogen dioxide. The final AQI number you see is typically the value of the 'worst' or dominant pollutant at that time—not an average of all of them. Some apps or trackers, however, may only measure PM2.5 and report an AQI based solely on that. If the dominant pollutant happens to be ozone on a particular day, a tracker that only 'sees' PM2.5 will report a very different, likely lower, AQI.
The Crucial Element of Time
Another key variable is the averaging period. Official CPCB stations generally report a 24nd hour average to give a stable, day long picture of pollution exposure. Many real time apps,' however,' provide hourly updates or use shorter 'NowCast' algorithms that weigh recent hours more heavily.' This is why you might see an app's AQI spike dramatically after a burst of traffic or a nearby fire,' while the official government portal shows a more stable,' albeit still high,' number.' Neither is necessarily 'wrong—they are just measuring different timeframes.