





Understanding the Data We Use
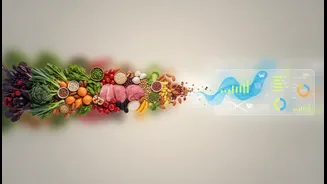
When we talk about national food consumption trends, we often refer to information gathered from large-scale surveys like the Household Consumption Expenditure Survey (HCES) by the National Sample Survey Office (NSSO). These surveys ask households what
food items they have purchased or consumed over a period. This data is crucial, providing a broad overview of spending patterns, the shift from staples like cereals to items like dairy and processed foods, and the differences between rural and urban areas. Policymakers and researchers use these insights to gauge poverty levels, track inflation, and design public welfare programs. It forms the backbone of our understanding of the nation's nutritional landscape.
The Gap Between the Bill and the Belly
The fundamental limitation is that a household is not a single person. Data on purchases reveals what food enters a home, but it cannot tell us how that food is distributed among the members inside. Several factors create a significant gap between household 'availability' and individual 'intake'. First, there is food wastage, where items spoil or are thrown away. Second, meals may be shared with guests or domestic staff. Most critically, the allocation of food within the family is often unequal. Studies show that who gets to eat what, and how much, can depend on age, gender, and their perceived economic contribution to the household. This means simply dividing a household's total food consumption by the number of members gives a misleading average.
The Hidden Disparity: Who Misses Out?
Intra-household food allocation is often where nutritional inequality begins. In many parts of India, a long-standing cultural practice is that men and earning members eat first, while women and children eat last and often get smaller portions of nutrient-dense foods like fruits, vegetables, and dairy. One study highlighted that in nearly 28% of surveyed households, girls ate after boys, a practice that can have significant negative effects on their health and nutritional outcomes. Therefore, even in a household that purchases an adequate amount of nutritious food, the actual intake for women and children can be dangerously low, a reality that average consumption figures completely obscure. This vulnerability is a critical blind spot in our public health data.
Why This Data Gap Matters for Policy
If our foundational data is incomplete, the policies built upon it may be flawed. For instance, if nutritional programs are designed based on the assumption that food is shared equally within a household, they may fail to reach the most vulnerable individuals. A policy might aim to increase protein consumption by subsidizing pulses, but if those pulses are disproportionately consumed by male members, the nutritional status of women and children in that same household may not improve. Accurately identifying malnutrition, tracking the success of interventions like the PDS (Public Distribution System), and formulating effective strategies to combat stunting and anaemia require a more granular understanding of who is truly undernourished, not just which households are buying less food.
Toward a More Accurate Nutritional Picture
Closing this data gap is essential for effective policymaking. The solution isn't to discard household expenditure surveys, which remain valuable for tracking economic trends. Instead, they must be supplemented with more detailed methods. Individual dietary intake surveys, which use 24-hour recall methods to ask people exactly what they ate, provide a much clearer picture of actual consumption. While more expensive and time-consuming to conduct on a national scale, these targeted surveys offer the specific insights needed to understand intra-household dynamics. By combining the broad strokes of household purchase data with the fine detail of individual intake studies, India can develop a more accurate, equitable, and effective strategy to ensure nutritional security for every single citizen.