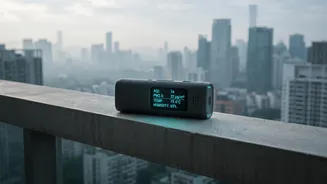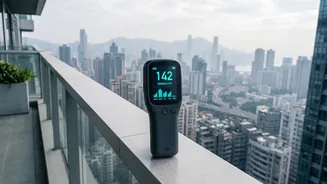



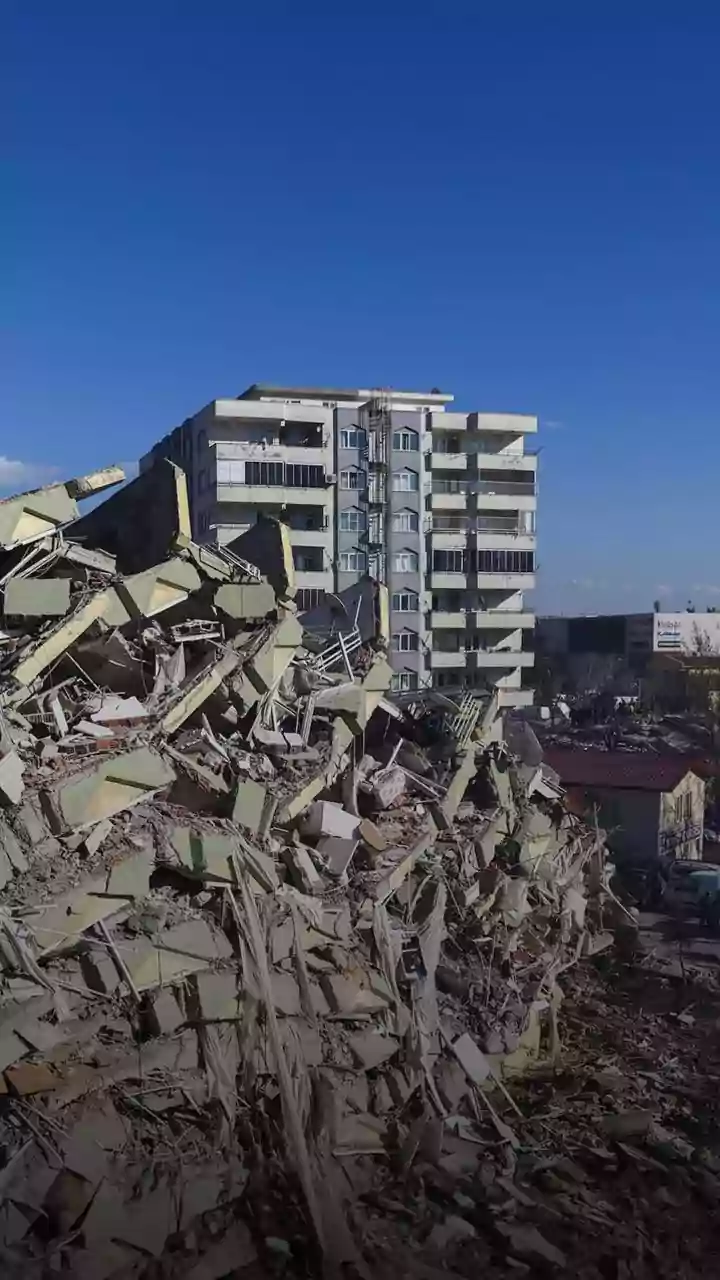



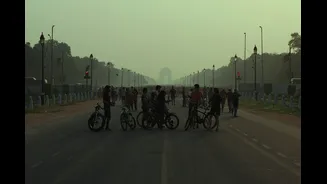
As festive seasons and daily traffic choke our city air, knowing what you breathe is the first step to staying healthy. This guide helps you easily track air quality, especially in high-risk zones like busy roads and market hubs.
Why Traffic and Festivals Are Pollution Hotspots
Major traffic junctions
and bustling festive markets are epicentres of air pollution for clear reasons. Intersections are plagued by slow-moving or idling vehicles, which release higher concentrations of pollutants like nitrogen dioxide (NO₂) and carbon monoxide (CO). Add to this the constant churn of dust from roads and nearby construction, and you have a daily recipe for poor air quality. Festive seasons amplify this problem significantly. Firecrackers release a dense cloud of harmful metals and particulate matter. Temporary food stalls often use coal or firewood for cooking, while increased power demand leads to greater reliance on diesel generators, all contributing to a sharp, localized drop in air quality that can linger for days.
Decoding the Numbers: AQI, PM2.5, and PM10
Before you start tracking, it helps to know what you're looking for. The Air Quality Index (AQI) is your main tool. It's a single number, typically on a scale of 0-500, that simplifies complex data into six categories: Good, Satisfactory, Moderate, Poor, Very Poor, and Severe. The higher the AQI, the greater the health risk. The AQI is calculated based on several pollutants, but two are critical to watch: PM2.5 and PM10. These refer to particulate matter smaller than 2.5 and 10 micrometres, respectively. PM10 includes dust and pollen, which can irritate your nose and throat. PM2.5 particles are far more dangerous; they are fine enough to penetrate deep into your lungs and even enter your bloodstream, linked to respiratory infections, heart disease, and other serious conditions.
Government Apps: Your Official Source
For the most reliable, government-validated data, two apps are essential. SAMEER, developed by the Central Pollution Control Board (CPCB), provides hourly AQI data from its extensive network of monitoring stations across more than 100 cities. It breaks down pollutant levels (PM2.5, PM10, CO, etc.) and even allows users to file complaints about pollution-related violations. The other key resource is SAFAR-Air, from the Ministry of Earth Sciences. While its coverage is limited to a few metro areas like Delhi, Mumbai, Pune, and Ahmedabad, its strength lies in providing a three-day forecast. This allows you to plan activities in advance based on predicted air quality changes.
Popular Third-Party Tracking Apps
Several thirdparty applications offer more userfriendly interfaces and additional features. IQAir AirVisual is a popular global choice with extensive coverage in India, providing realtime data, historical trends, and sevenday forecasts. It's known for its comprehensive world pollution map. BreezoMeter offers a detailed breakdown of pollutants and provides realtime, streetlevel air quality maps. Another strong option is the app simply called AQI India, which combines data from government sources and its own sensors to give a highly localized view of air quality. Many of these apps also offer health recommendations tailored to the current AQI and can alert you when pollution levels become hazardous.
What to Do With the Information
Tracking air quality is only useful if you act on the data. When the AQI enters the 'Poor' or 'Very Poor' categories (above 200), it's time to take precautions. Limit strenuous outdoor activities like jogging or sports. This is especially crucial for sensitive groups, including children, the elderly, and individuals with heart or lung conditions. Consider wearing a wellfitting N95 mask if you must be outdoors for an extended period. At home, keep windows and doors closed to prevent polluted air from entering. If you have an air purifier, run it during highpollution episodes. Simple adjustments based on realtime data can significantly reduce your exposure and protect your health during the worst pollution spikes.