






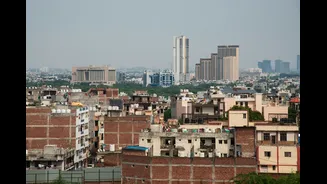


This week, social media buzzed with alarming Air Quality Index (AQI) numbers from Bikaner and Bathinda, some soaring past 1,000. But what do these figures truly mean? When a number this high appears, it's not just alarming, it's confusing.
A Tale of Two Cities
On November
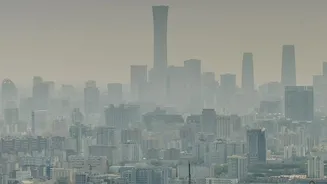
4, 2026, reports emerged showing Bikaner in Rajasthan with a staggering AQI of 1,357, while Bathinda in Punjab was not far behind, with readings reported over 1,100 on the preceding day. These figures, far exceeding the official 'Hazardous' category which typically caps at 500, painted a grim picture of the air quality in Northern India. The primary culprit cited was a combination of stubble burning, low wind speeds, and temperature inversions trapping pollutants near the ground. However, the dramatic numbers also sparked a conversation about their origins. Different platforms reported conflicting numbers around the same time, highlighting a core problem in public data dissemination. While one report cited an AQI of 1,357 for Bikaner at 6:45 am, another might show a different number from a different source. This inconsistency is not just academic; it has real-world consequences for public trust and health decisions.
Why Timestamps Are Crucial
An AQI number without a timestamp is like a weather forecast without a date—potentially irrelevant and misleading. Air quality is not static; it can change dramatically within hours. A 'Good' AQI reading from 5 a.m. is useless if you are planning an evening walk at 7 p.m. when traffic and industrial emissions have peaked. Stale data can give a false sense of security. For example, overnight air can seem artificially calm before morning traffic begins. Without a clear timestamp, citizens cannot make informed decisions about their exposure, such as when to exercise, send children out to play, or whether to wear a mask. Experts emphasize that looking at data averaged over a long period, like 24 hours, can also mask short, dangerous spikes in pollution. Real-time, or near real-time, data provides a much more accurate snapshot of the air we are about to breathe.
The Source Matters: Official vs. Unofficial Monitors
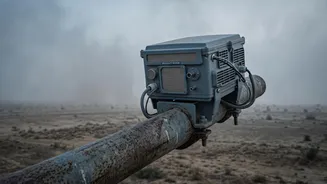
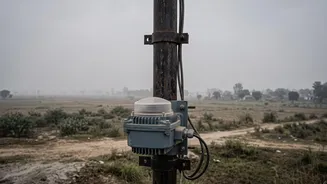
The source of an AQI reading is just as important as its timestamp. In India, there are different types of monitoring stations. Official regulatory-grade monitors, part of networks like the National Air Quality Monitoring Programme (NAMP), are held to rigorous standards for accuracy and placement. However, India has a significant shortfall of these monitors, with many rural and semi-urban areas having little to no coverage. This gap is often filled by a growing network of lower-cost, privately owned sensors, whose data appears on various apps and websites. While these sensors provide valuable hyperlocal information, their accuracy can vary. The placement of a sensor—for instance, next to a busy road versus in a leafy backyard—can heavily influence its readings. Furthermore, some unofficial platforms may use different calculation methods or uncapped scales, which is why they might show an AQI of 1,000 while official sources cap their public reporting at 500. This discrepancy doesn't mean one is 'wrong', but that they are measuring and reporting differently, which can create significant public confusion.
The Cost of Confusion
When the public is presented with conflicting or out_of_date information, it erodes trust in all air quality data. This can lead to data apathy, where people disregard official warnings because they seem to conflict with what they see on a different app. Inaccurate reports can also lead to poor health choices. Studies have shown that misleadingly good air quality reports can lead to people increasing their outdoor activities, inadvertently exposing themselves to higher levels of pollution. The health consequences of such exposure are severe, ranging from immediate respiratory distress to long_term cardiovascular and neurological issues. For a tool like the AQI to be effective, it must be trustworthy. This requires a transparent system where the source of the data is clear, the timestamp is recent, and the public is educated on how to interpret the numbers they see.