





Eyes in the Sky
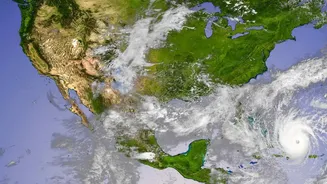
The process begins with a fleet of geostationary weather satellites, like India's own INSAT series, orbiting the Earth. These satellites are positioned in a way that they remain over the same spot, providing a constant stream of observations. They don't
just take simple photos like a camera. Instead, they carry sophisticated instruments called imagers and sounders that see the Earth in multiple 'spectral bands'. Think of it as having special vision that can detect different types of energy—like visible light, infrared (heat), and microwave radiation—that are invisible to the human eye. This allows them to monitor cloud cover, track storm systems, and gather data day and night across the entire globe, even over oceans and remote areas where ground-based instruments are scarce.
Decoding the Unseen Data
The term 'spectral data' refers to these measurements across different energy wavelengths. Each channel provides a unique clue. Infrared channels measure temperature, which helps meteorologists determine the height of cloud tops; colder, higher clouds are more likely to produce significant rain. Water vapour channels reveal the amount of moisture present in the atmosphere, highlighting plumes that could fuel heavy downpours. Microwave sensors have a special talent: they can partially 'see through' clouds to detect the actual raindrops and ice particles within them, offering a more direct estimation of precipitation. No single channel tells the whole story, but together, this multispectral data paints a detailed, three-dimensional picture of the atmosphere's structure and moisture content.
The Algorithm's First Pass
This massive firehose of spectral data is beamed down to Earth, where powerful supercomputers get to work. They run complex algorithms, such as the INSAT Multi-spectral Rainfall Algorithm (IMSRA) used by the India Meteorological Department (IMD), to translate the raw brightness and temperature values into an initial rainfall estimate. These algorithms are essentially sophisticated sets of rules and relationships, refined over years of research, that correlate specific satellite signals with observed rainfall rates on the ground. The computer models churn through these calculations to produce a 'first guess' forecast map, showing where rain might be falling and how intensely. This automated step provides a broad, continuous view of weather patterns.
The Essential Human Touch
However, satellite estimates are not perfect. They can have biases, sometimes over or underestimating rainfall in certain regions. This is where human expertise becomes indispensable. Trained meteorologists take the algorithm's output and cross-reference it with a whole suite of other tools. They analyse data from ground-based weather radars, which provide highly detailed, real-time information on precipitation at a local level, though with limited range. They also look at observations from weather stations, reports from trained spotters, and their own deep knowledge of local weather patterns. This 'human-over-the-loop' approach allows them to critically assess the model's output, correct its errors, and increase the forecast's accuracy and reliability.
From Raw Data to Your Phone
After this rigorous process of analysis and refinement, the final, quality-controlled data is ready. It is transformed into the intuitive, colour-coded maps that we see on our screens. These maps provide hyperlocal, street-level detail, showing the precise location, movement, and intensity of rainfall. This incredible synthesis of automated data processing and expert human judgment is what turns abstract measurements from space into a clear, actionable forecast that helps you decide whether to carry an umbrella for your evening walk. It's a daily miracle of modern science that brings global atmospheric monitoring right down to your neighbourhood.