



The Big Picture from Above
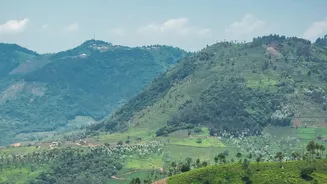
The first step in understanding landscape-level change is often to look at it from space. Ecologists use remote sensing technologies, including satellite imagery, to monitor vast and often inaccessible areas of the Western Ghats. By comparing images taken
over several years, scientists can track large-scale trends like deforestation, the expansion of plantations, and changes in land use. Advanced techniques like the Normalized Difference Vegetation Index (NDVI) use spectral data to assess plant health and density, essentially creating a map of 'greenness' that reveals areas where vegetation is thriving or struggling. This bird's-eye view is crucial for identifying 'hotspots' of degradation that require a closer look on the ground.
Getting Their Hands Dirty with Soil Analysis
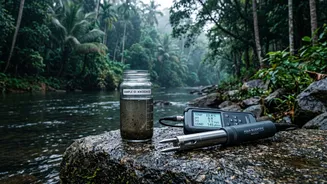
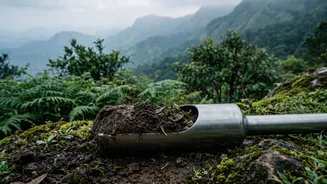
While satellites provide scale, the true story of degradation is written in the soil itself. Ecologists conduct detailed field surveys to collect soil samples, which are then taken to a laboratory for analysis. Key indicators of soil health include its organic matter content, nutrient levels, and pH. Degraded soils often show depleted nutrients and low organic matter, which reduces their ability to hold water and support plant life. Another critical measurement is the soil's physical structure. Scientists perform tests, like the 'slake test', to assess aggregate stability—how well the soil holds together when exposed to water. Poor stability leads to erosion, where precious topsoil is washed away by heavy monsoon rains, a major concern in Kerala's highlands.
Modelling Erosion Risk
To predict and manage soil loss, ecologists use sophisticated models like the Revised Universal Soil Loss Equation (RUSLE). This method combines several key factors to estimate the annual rate of soil erosion for a specific area. These factors include rainfall erosivity (the power of rain to cause erosion), soil erodibility (the soil's natural susceptibility), topography (the length and steepness of slopes), and land cover (the type of vegetation). By feeding data from weather stations, soil maps, and digital elevation models into a Geographic Information System (GIS), scientists can create detailed maps that pinpoint areas most vulnerable to erosion, helping to prioritise conservation efforts.
Walking the Line: Vegetation Surveys
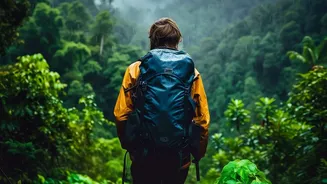
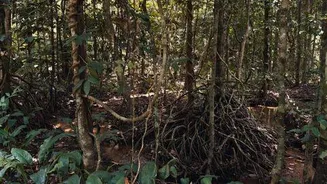
Assessing vegetation degradation requires more than just knowing if trees are present. It involves understanding the composition and health of the plant community. Ecologists use established survey methods like transects and quadrats. A transect is a straight line laid across a habitat, along which scientists record every plant species they encounter. Quadrats are square frames of a fixed size (e.g., one square metre) placed at intervals, within which researchers count the number of different species, their density, and overall cover. This data helps determine biodiversity levels and can reveal the spread of invasive species, which often thrive in degraded areas. Comparing a site to a nearby healthy benchmark area provides a clear measure of degradation.
The Power of Local Knowledge
Beyond scientific instruments and models, there is a growing recognition of the value of local and indigenous knowledge. Communities that have lived in the highlands for generations possess an intricate understanding of long-term ecological changes that scientific data might miss. Through participatory mapping and transect walks with community members, ecologists can gather qualitative data on changes in water availability, forest cover, and the presence of key indicator species. This approach, often part of 'Participatory Biodiversity Management', not only enriches the scientific assessment but also empowers local communities, making them active partners in conservation.