
Eyes in the Sky
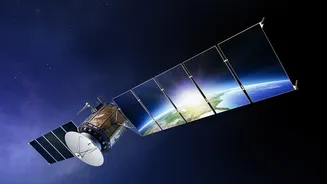
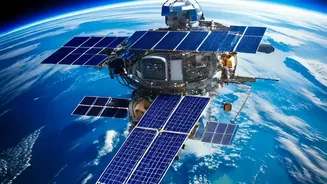
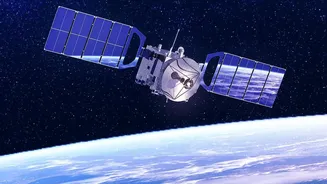
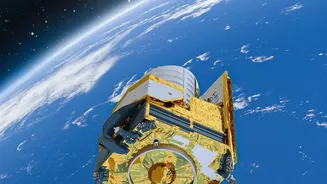
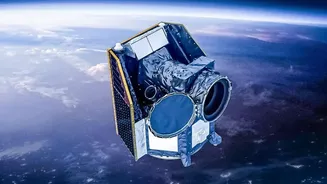
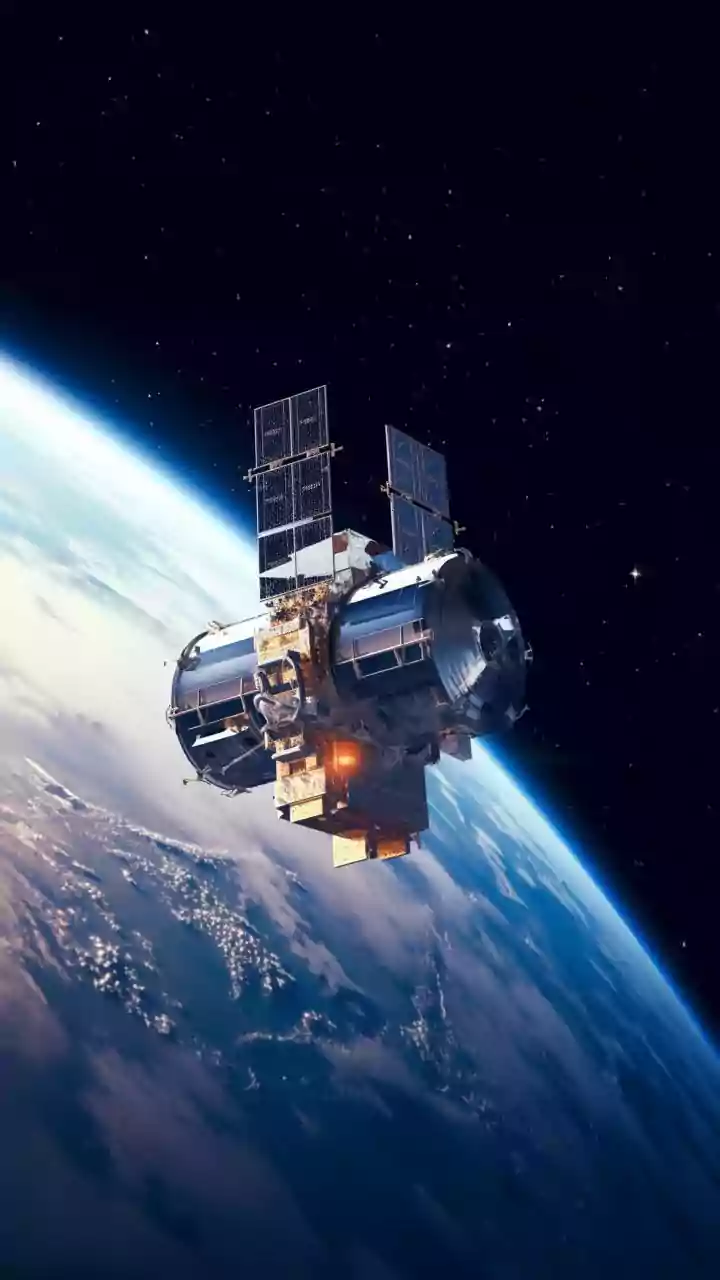
The process begins hundreds of kilometres above Earth, where a fleet of satellites, including those operated by ISRO, constantly watch over our planet. These are not simple cameras. They are equipped with advanced sensors that capture energy from across
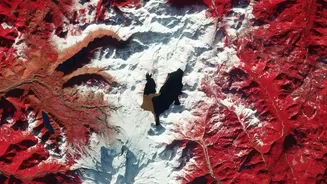
the electromagnetic spectrum, much of which is invisible to the human eye. Healthy plants, for example, strongly reflect near-infrared (NIR) light while absorbing red light. By measuring these specific wavelengths, scientists can gather precise data about everything from forest health and crop conditions to atmospheric gases and sea surface temperatures. Each measurement is recorded as a numerical value for a specific area on the ground, known as a pixel.
Cleaning Up the Signal
The raw data beamed back to Earth is a chaotic jumble of numbers, not a clean image. Before it can be understood, it must be processed. Scientists first perform crucial corrections. They adjust the data to account for the angle of the sun, atmospheric haze or clouds that can distort the signal, and the position of the satellite itself. This step, known as calibration, ensures that measurements taken at different times and places are accurate and comparable. The raw data, often separated into different light bands, is then combined to create a more coherent, though still uninterpreted, image.
Teaching the Computer to 'See'
This is where the magic of interpretation happens. Scientists use algorithms—complex sets of mathematical rules—to translate the corrected numerical data into meaningful information. One of the most common is the Normalized Difference Vegetation Index, or NDVI. This formula compares the reflectance of near-infrared light with red light to calculate the density and health of vegetation. A high NDVI value indicates lush, healthy plant life, while low values can signify stress, drought, or bare soil. Similar indices exist to measure water quality, snow cover, and urban expansion. Increasingly, Artificial Intelligence is used to identify patterns in vast datasets, helping to automate the detection of changes like deforestation or urban sprawl.
Checking with Reality on the Ground
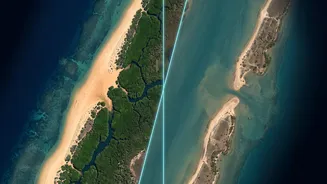
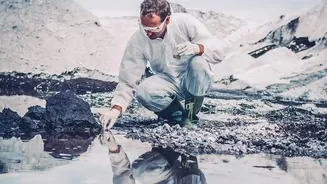
As powerful as satellites are, the data isn't trusted blindly. Scientists perform a critical validation step called 'ground truthing'. This involves sending teams into the field to take direct measurements and make observations at the exact locations the satellite has imaged. They might measure the actual depth of a river, sample the soil in a field identified as 'stressed' by NDVI, or confirm the species of trees in a forest. This on-the-ground data is then compared with the satellite's interpretation to verify its accuracy and refine the algorithms. For instance, ISRO's monitoring of Himalayan glacial lakes combines four decades of satellite imagery with essential fieldwork to assess flood risks accurately.
Telling the Story with a Map
Once the data is processed, interpreted, and verified, the final step is visualization. Scientists and cartographers use Geographic Information Systems (GIS) to transform the massive datasets into intuitive, easy-to-read maps. This involves assigning colours and scales to the data—for instance, using a green-to-red scale to show vegetation health or shades of blue for water depth. These layers of information can be combined with other data, like roads, city boundaries, or elevation, to provide crucial context. The final product is more than just a picture; it’s a powerful tool that transforms complex environmental data into actionable knowledge, helping to monitor croplands, track cyclones, and manage our natural resources.