





The Fourth-Year Spectacle
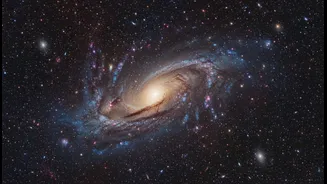
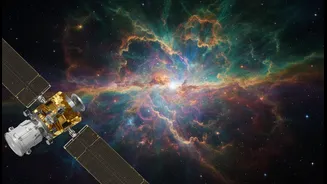
Following its tradition of releasing a stunning new view of the universe each July, NASA has marked four years of JWST science with an unprecedented look at a supernova remnant—the expanding shell of a star that exploded long ago. While previous anniversary
images have showcased star-forming nurseries like the Rho Ophiuchi complex and interacting galaxies, this year’s target provides a detailed look at the end of a star's life. The intricate web of energized gas and dust, glowing with the force of the ancient explosion, offers a powerful look at how dying stars seed the universe with the heavy elements necessary for forming new planets and even life. But while the image is a visual masterpiece, its real value lies in the data hidden within.
Seeing the Invisible
The first and most important thing to verify is that the colors you see are not what your eyes would. The James Webb Space Telescope is an infrared observatory, designed to detect light that is invisible to humans. This allows it to peer through dense clouds of cosmic dust and see objects that are too distant, old, or cool to be observed in visible light. The raw data beamed back to Earth arrives as black-and-white images from the telescope's various filters. Image processors at the Space Telescope Science Institute then translate these different wavelengths of infrared light into the visible colors we can perceive. This process is known as using 'representative color'.
A Guide to Translating Color
The colors in a Webb image are not arbitrary artistic choices; they are a direct translation of scientific data. Generally, scientists assign colors in chromatic order, similar to a rainbow. The longest infrared wavelengths are assigned to the color red, while the shortest are assigned to blue. Wavelengths in between are mapped to greens, yellows, and cyans. This technique allows researchers to visualize different features. For example, in a nebula, the redder tones might highlight the presence of molecular hydrogen, while bluish areas could indicate dense pockets of stars. By translating invisible light into a visible spectrum, scientists can distinguish different chemical elements and temperatures within the same image, turning a beautiful picture into a detailed physical map.
The Signature Star Spikes
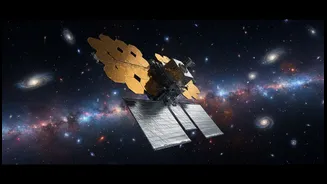
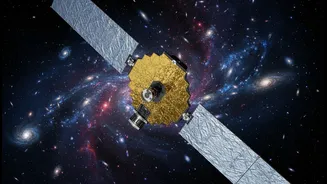
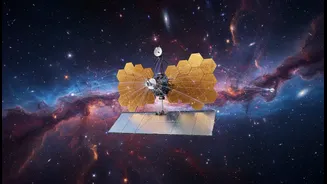
One of the most iconic features of a Webb image is the sharp, eight-pointed diffraction spike that radiates from bright stars. These are not a natural phenomenon of the stars themselves. Instead, they are an artifact created by the telescope's unique structure. As light from a distant star enters the telescope, it bends around the edges of the 18 hexagonal segments that make up Webb's primary mirror. This creates six of the bright spikes. The other two, fainter spikes are caused by the three struts that hold the telescope's secondary mirror in place. Far from being a flaw, this signature starburst is a fingerprint of the telescope itself, an instant giveaway that you're looking at a view from Webb.
From Image to Insight
While the images capture public attention, much of the telescope's most important work comes from a technique called spectroscopy. About three-quarters of Webb's observation time is dedicated to this process, where light from a celestial object is split into its component wavelengths, like a prism creating a rainbow. Each chemical element absorbs and emits light at specific wavelengths, creating a unique 'fingerprint' within the spectrum. By analyzing these patterns, scientists can determine a star's temperature, an exoplanet's atmospheric composition, or a galaxy's distance and chemical makeup without ever visiting it. So when you see a new Webb image, remember that it's just the visual entry point into a much deeper scientific investigation.