





The National Picture: A Flawed Snapshot
Every monsoon season, the IMD releases its forecast, often summarised as a single percentage of the Long Period Average (LPA). This figure gives us a broad, nationwide overview. For the second half of the 2026 monsoon, the IMD has predicted 'below-normal'
rainfall for the country as a whole, specifically for August and September. While this national average is a useful starting point, it treats India as a single entity, averaging out vast differences in rainfall. It can mask the fact that one region might be experiencing devastating floods while another is parched by drought, a phenomenon that has become increasingly common.
Uneven Rains: The Devil in the Distribution
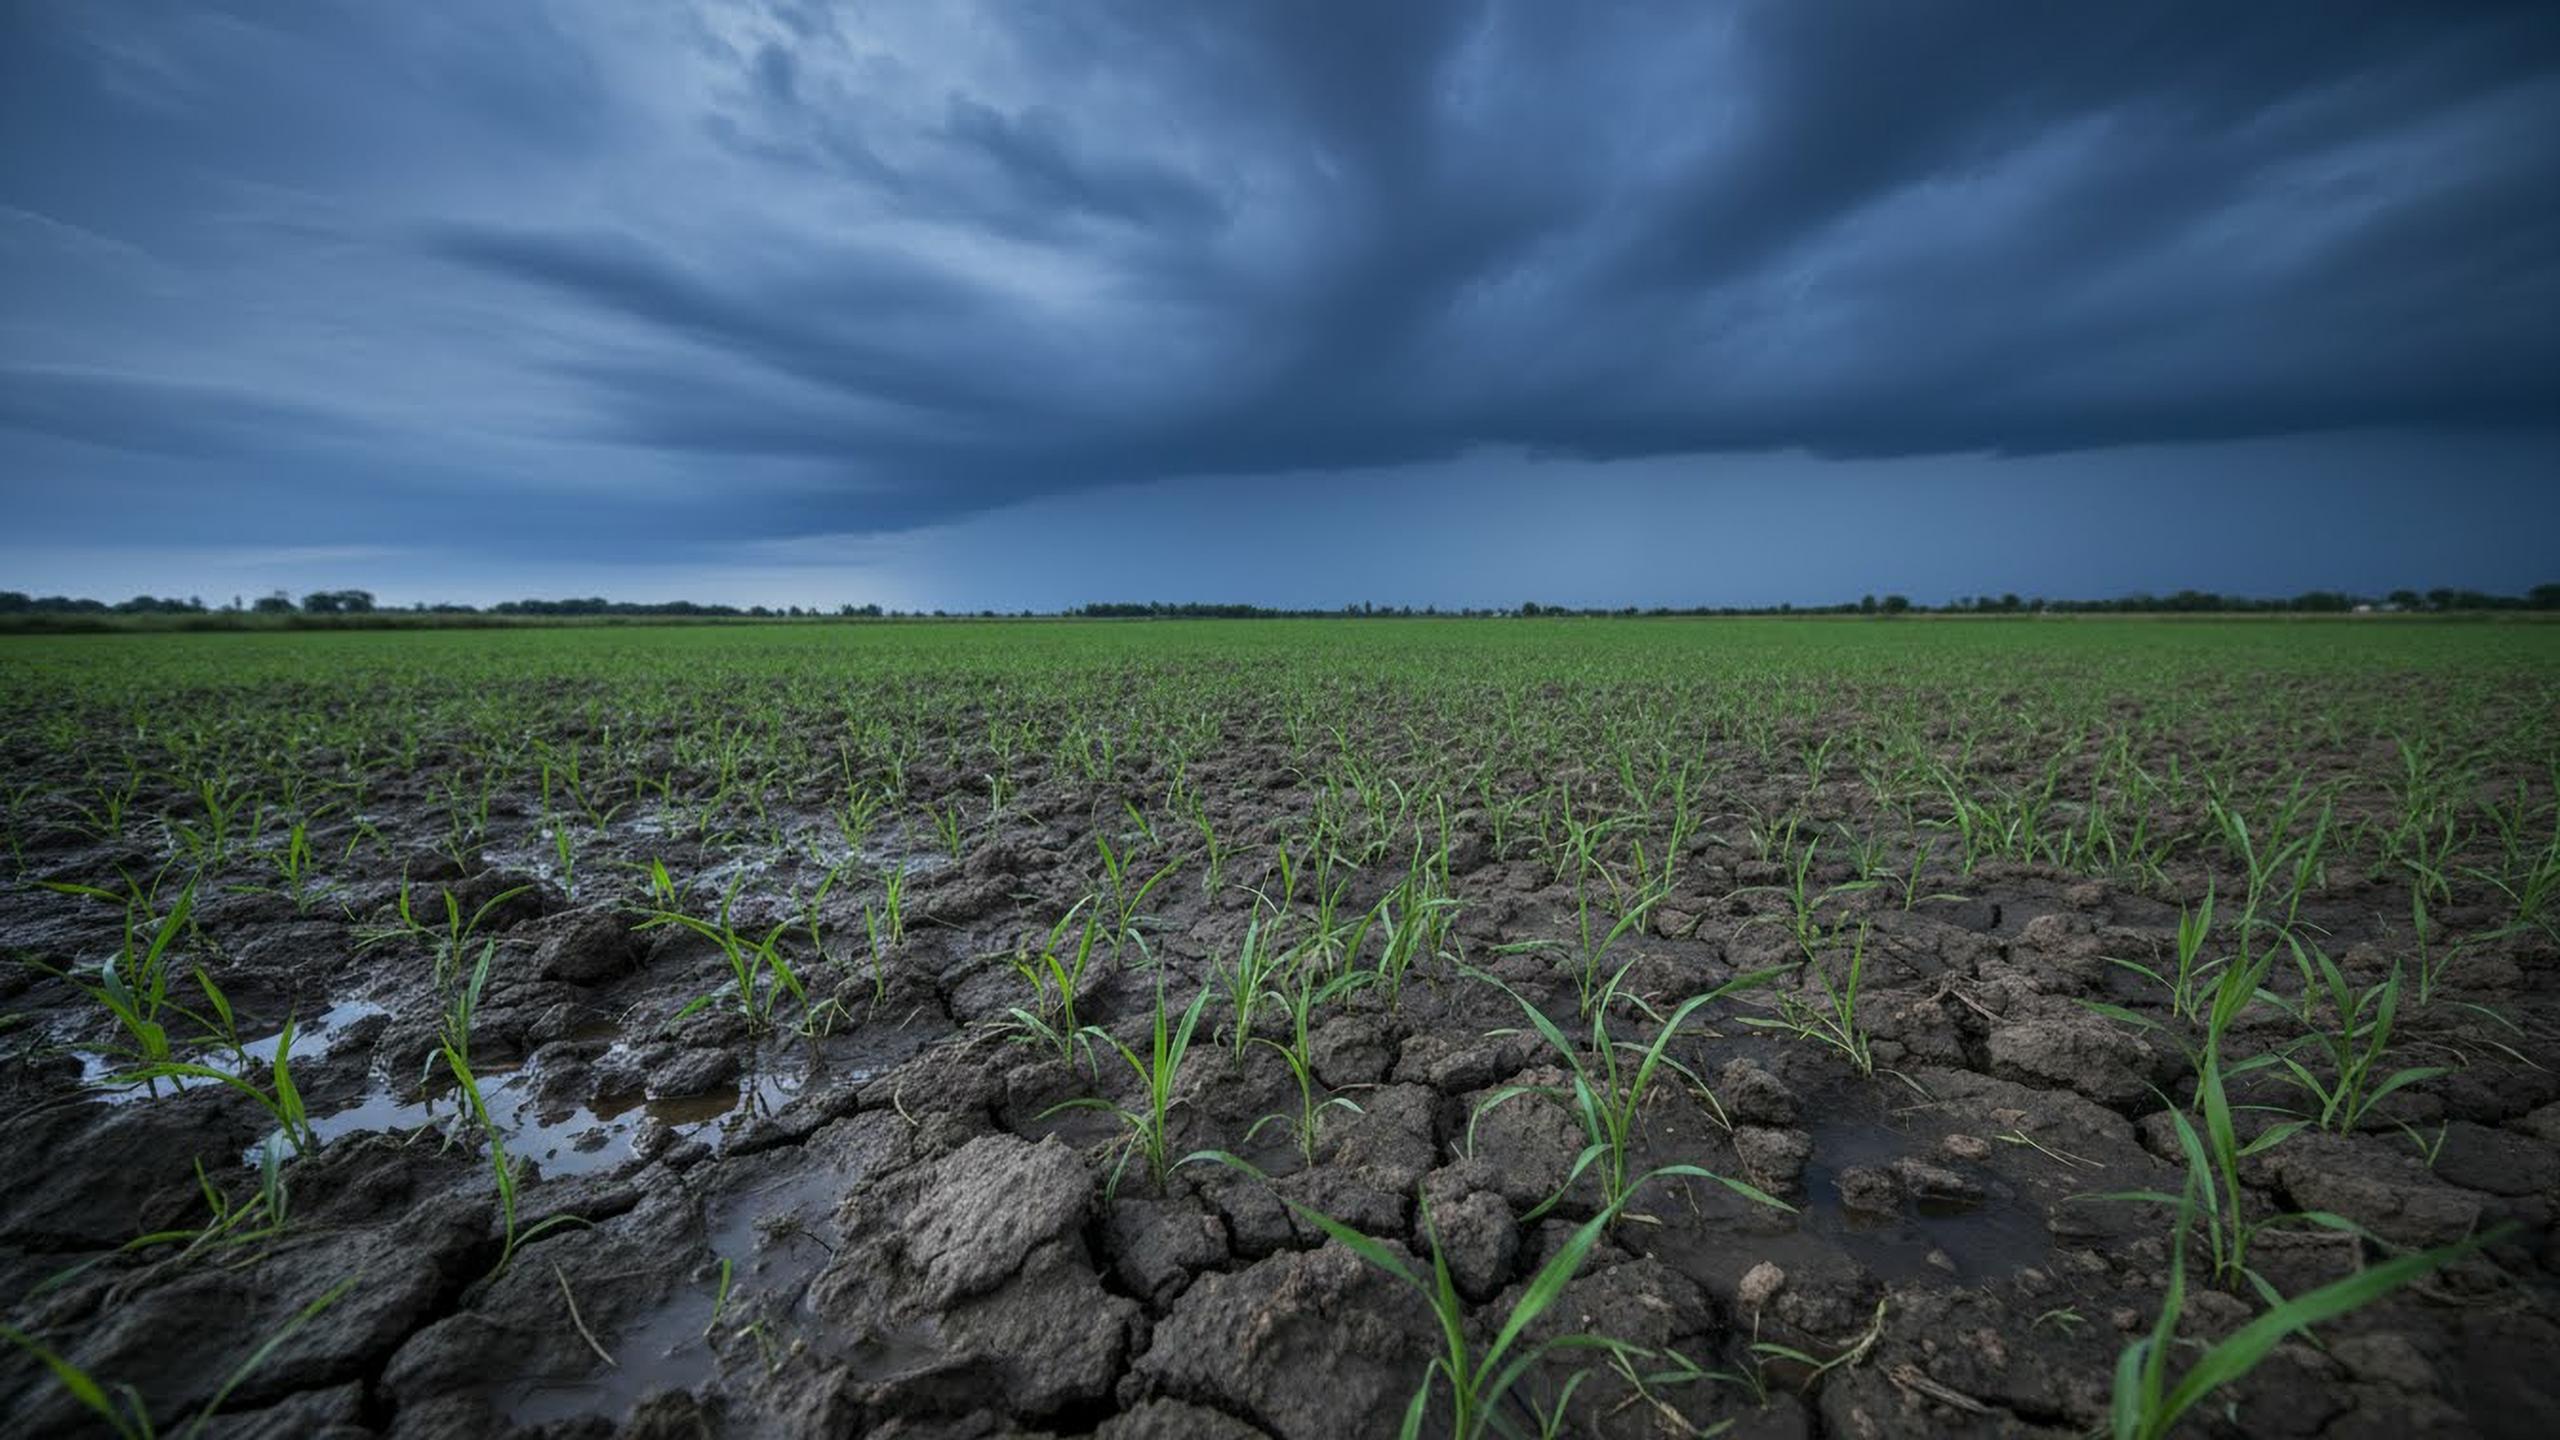
The real story of the monsoon is its distribution—both in terms of geography and time. A 'normal' or 'below-normal' national figure says little about whether the rain fell where and when it was needed most. For example, even in July 2026 which saw normal rainfall overall, the distribution was uneven, with 46% of districts receiving deficient rain. Intense, short bursts of rain are becoming more frequent, leading to floods and soil erosion without effectively recharging groundwater. Conversely, long dry spells during critical sowing periods can devastate agriculture, regardless of whether the final national tally looks good. This erratic pattern means a 'normal' monsoon on paper can feel like a crisis on the ground.
Reservoirs: The Real Water Balance Sheet
This is where local reservoir levels become a much more accurate indicator of a region's water health. Reservoirs are the country’s primary buffers, storing monsoon runoff for drinking water, irrigation for the rabi crop, and generating hydroelectric power. Their levels provide a tangible measure of available water, something the abstract rainfall percentage cannot. When rain is intense and runs off quickly, it's the dams and reservoirs that capture this precious resource. If they aren't filling up, it signals future stress for cities and farms, even if the skies have been generous. The Central Water Commission (CWC) monitors major reservoirs, and their data provides a critical, region-specific report card on water availability.
A Tale of Contrasting Fortunes
The situation across India right now highlights this disparity. While heavy rains have led to a red alert at the Kakkayam dam in Kozhikode, with the reservoir near full capacity, other regions paint a different picture. In Punjab, key reservoirs like Bhakra are at lower levels compared to last year due to reduced inflows, despite having released extra water earlier in the season. The live storage at Bhakra is below the ten-year average. In the south, while recent inflows have boosted levels at the Srisailam reservoir in Telangana and Andhra Pradesh, it had previously neared its dead storage level. Meanwhile, flooding in parts of Kerala has occurred even as reservoir levels in major dams like Pamba and Kakki are reported as 'comfortable' at 35-44% capacity, showing how localised deluges can cause chaos independently of large-scale storage.
How to Check Your Local Water Status
Tracking your local water situation is becoming increasingly important. The Central Water Commission (CWC) provides weekly bulletins on the storage status of 150+ major reservoirs across the country on its website. This data is often broken down by region and state, giving a much clearer picture than the national monsoon forecast. Many state water resource departments also maintain portals with data on local dam levels. By paying attention to these figures, citizens, farmers, and local administrators can better understand their actual water security and prepare for potential shortages or flood-related measures, moving from being passive recipients of national news to informed local stakeholders.