





Eyes in the Sky
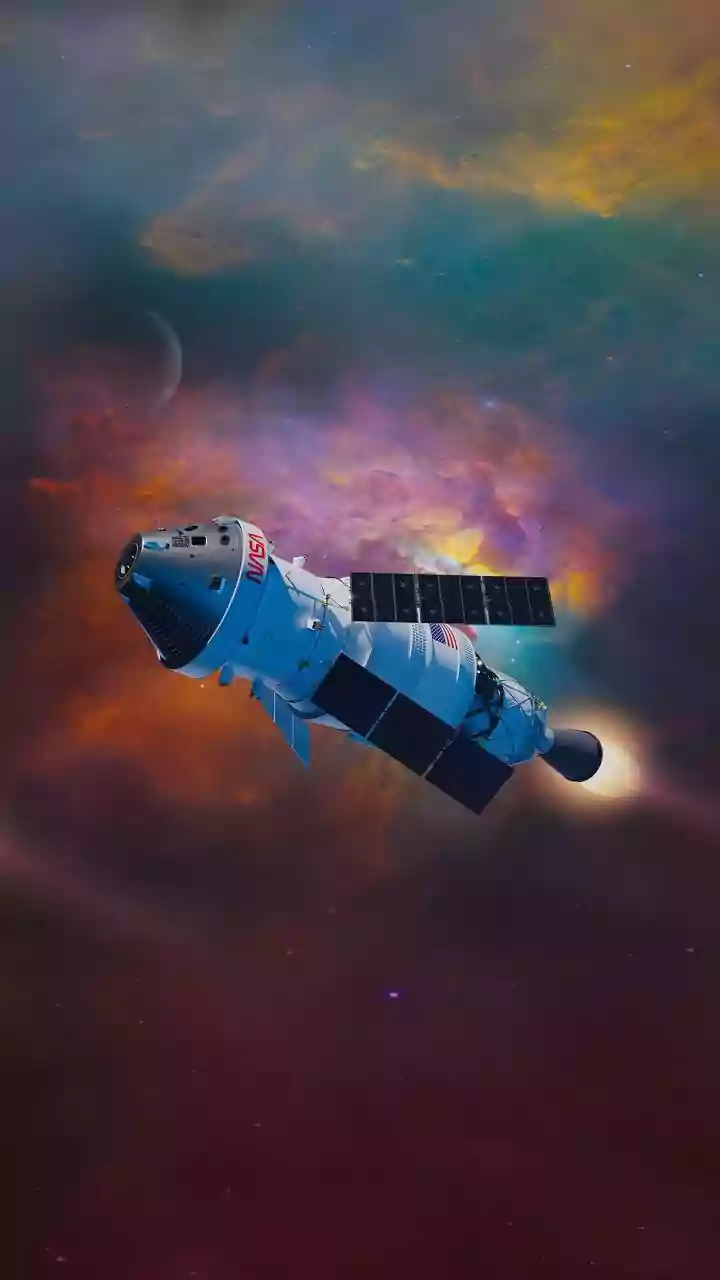
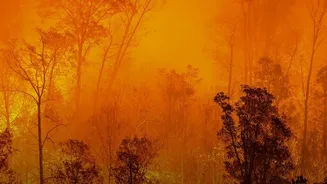
The first line of investigation starts hundreds of kilometres above the Earth. Researchers use data from satellites operated by agencies like ISRO and NASA to get a big-picture view. Instruments like the Visible Infrared Imaging Radiometer Suite (VIIRS)
can detect the heat signatures of active fires on the ground, providing daily counts of fire incidents in states like Punjab and Haryana. These satellites also measure something called Aerosol Optical Depth (AOD), which indicates how much sunlight is blocked by particles in the air, giving a proxy for pollution levels. However, this method has limitations. Satellites pass over at specific times, and farmers may burn their fields later in the day to avoid detection. Cloud cover can also obscure the view, meaning satellite data alone doesn't capture the full story.
Boots on the Ground
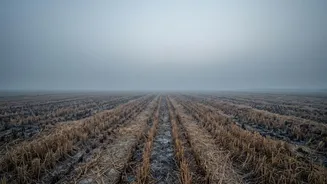
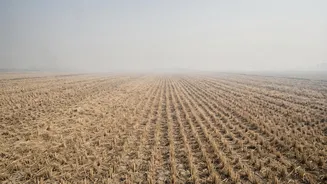
To get a more accurate reading, satellite data must be paired with ground-level measurements. A network of air quality monitoring stations across the country provides real-time data on pollutants like PM2.5—fine particulate matter small enough to enter the lungs and bloodstream. Mobile monitoring labs can also be driven directly to rural hotspots for more targeted analysis. Researchers combine this with on-the-ground surveys, asking farmers directly about their practices to estimate the total mass of residue being burned. This combination of remote and in-situ data helps build a more complete and validated picture of the pollution's intensity and scale.
Finding the Chemical Fingerprint
A major challenge is distinguishing smoke from crop burning from all the other sources of pollution, such as traffic and industry. To do this, scientists perform a kind of chemical forensics. They collect air samples on filters and analyze their composition using techniques like mass spectrometry. Smoke from burning biomass (like rice or wheat straw) releases specific chemical markers. One of the most important is levoglucosan, a sugar derivative produced when cellulose burns. Its presence in an air sample is a tell-tale sign of biomass smoke. By measuring the ratio of levoglucosan to other pollutants, like elemental carbon (soot), researchers can estimate what percentage of the total air pollution comes specifically from crop fires.
Modeling the Smoke's Journey
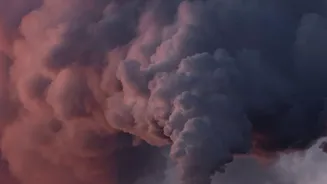
Once a fire is detected and its smoke is chemically identified, the next question is: where does it go? Researchers use sophisticated atmospheric transport models, such as the HYSPLIT model from NOAA, to simulate this. By inputting data on wind speed and direction, these models can track how a plume of smoke from a specific fire in Punjab might travel, and predict its impact on air quality in downwind cities like Delhi hours or even days later. These models are crucial for understanding how localized burning events contribute to widespread regional haze and for issuing timely public health warnings.