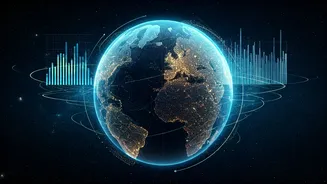

A New Perspective on Learning
For decades, geography and environmental science were taught through textbooks and static maps. Students learned about deforestation from a paragraph or the scale of a river delta from a diagram. While useful, this knowledge is always at a remove. Satellite
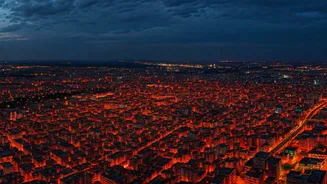
imagery changes everything by giving students a direct, dynamic view of the planet. It allows them to see how cities expand, where forests are shrinking, and how coastlines change over time. Instead of just reading about environmental issues, they can witness them, turning abstract concepts into tangible, visual evidence. This isn't just a fancier map; it's a tool for inquiry, allowing students to ask and answer their own questions using the same kind of data that professional researchers use.
Building Skills for the Future
Working with satellite data does more than just teach geography. It builds a suite of skills essential for the 21st century. Students learn data literacy by sorting through images and information to find what is relevant. They develop critical thinking and spatial reasoning by analysing patterns, such as agricultural grids or urban density. This process encourages a problem-solving mindset, as students might investigate the cause of pollution in a local lake or track the impact of a new highway. These are the abilities that drive innovation in fields from urban planning to disaster management and technology. By engaging with these tools early, students are not just completing an assignment; they are getting practical experience in STEM fields and preparing for future careers.
Free and Accessible Tools for the Classroom
The best part is that this technology is no longer restricted to high-tech labs. Several powerful, user-friendly platforms offer free access to vast archives of satellite data. For Indian students and teachers, ISRO's Bhuvan portal is an invaluable resource. It provides a gateway to Indian Earth observation data, with specific applications and map-based learning tools designed for schools in collaboration with NCERT. Globally, platforms like Google Earth Engine, NASA's Earthdata, and the Copernicus Open Access Hub provide incredible datasets that are free to use for educational purposes. Tools like these allow users to not only view images but also compare them across different time periods, apply analytical filters, and even create animations to show change.
Project Ideas to Spark Curiosity
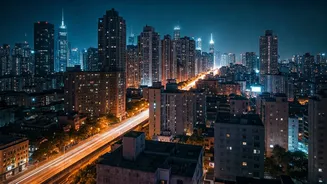
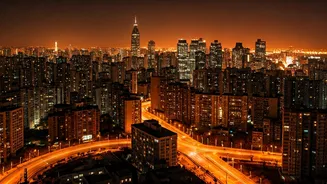
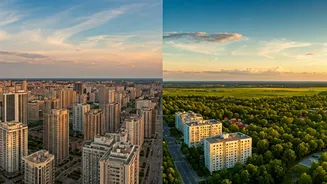
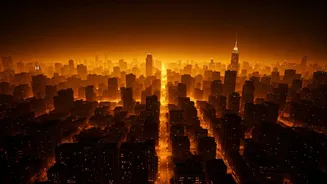
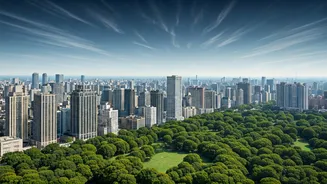
The possibilities for projects are nearly limitless and can be tailored to any locality. A class in a major metro like Delhi or Mumbai could use historical imagery to map urban sprawl over the last 20 years. Students in coastal states could track shoreline erosion or the health of mangrove forests. In agricultural regions, a project could involve analysing crop patterns or the impact of drought by comparing images from different seasons. Other ideas include monitoring the water levels of a local reservoir, tracking deforestation in a nearby forest patch, or even studying the 'urban heat island' effect by comparing surface temperatures in green versus built-up areas of their own city. These projects make learning personal and relevant, connecting students directly to their immediate environment.
Getting Started in Your School
For educators looking to introduce this, the key is to start simple. Begin with a guided exploration of a platform like Bhuvan or Google Earth. Choose a single, compelling question to answer, such as "How has our school's neighbourhood changed in the last decade?" Use the platform's built-in tools to find and compare two images from different dates. Focus on telling a story with the images. What has disappeared? What is new? Why might these changes have happened? Many platforms offer tutorials and ready-made lesson plans for grades 3-12, making it easier than ever to integrate this powerful tool. The goal isn't to become a remote sensing expert overnight, but to open a door to a new way of seeing and understanding the world.