

A Tale of Two Polygons
Since its discovery by the Voyager spacecraft in the early 1980s, Saturn’s northern hexagon has baffled and fascinated scientists. It is an astonishingly persistent weather pattern, a jet stream locked in a near-perfect six-sided shape that has remained
stable for decades. For a long time, it appeared to be a planetary one-off. The south pole, as observed for 13 years by the Cassini probe, featured a massive, hurricane-like vortex but no corresponding polygon. That all changed in September 2026, when astronomers announced a stunning discovery. Using the Hubble Space Telescope and data from amateur observers, they confirmed that a new shape had emerged: a 10-sided pattern, or decagon, brewing around the south pole. This feature is a newcomer, having formed sometime between 2023 and 2025, long after the Cassini mission ended. Unlike the seemingly permanent hexagon, this southern decagon is an evolving system, giving scientists a rare chance to watch a giant planetary storm take shape in real time.
Seeing in Different Light
Understanding these colossal storms requires more than just a simple photograph. Scientists rely on observing them across different wavelengths of light, from ultraviolet (UV) to visible and infrared. Think of it like having multiple superpowers for your eyes. Visible light shows you what you’d see if you were there. Infrared vision allows you to see heat. Ultraviolet helps you see things that are otherwise invisible in the upper atmosphere. Each wavelength peels back a different layer of Saturn’s dense atmosphere, revealing different parts of the storm’s structure and dynamics. By combining these views, astronomers can build a complete, three-dimensional profile of the weather systems, from the highest, sun-drenched hazes down to the warm depths.
Infrared Views: Peering into the Heat
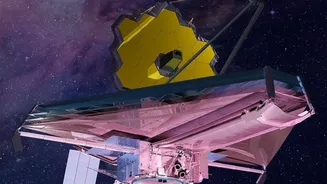
Infrared is the wavelength of heat. When telescopes like the James Webb or the former Cassini spacecraft look at Saturn in infrared, they are not just seeing reflected sunlight; they are detecting thermal emissions radiating from deep within the planet. This allows them to bypass the surface haze and measure temperature. At the south pole, infrared views revealed a 'hot spot' at the center of the vortex, a clear sign that air is sinking and warming as it descends into the atmosphere. These observations also show the structure of the clouds. For the southern storm, infrared data showed that the clouds forming its towering eyewall are between 30 and 75 kilometers high—far taller than any hurricane on Earth. A lack of clouds allows more heat to escape, making those areas appear brighter in certain infrared images, which is how scientists map the storm's churning structure.
Visible and UV: Mapping the Upper Layers
Visible and ultraviolet (UV) light tell a different story, one written in the uppermost layers of the atmosphere. On Saturn, gases like hydrogen and helium scatter short-wavelength UV light very effectively, which tends to make the whole atmosphere glow brightly. However, tiny haze particles or aerosols floating high up absorb UV light, making them appear as dark silhouettes against the bright backdrop. This makes UV light an excellent tool for tracing the path of jet streams and the distinct outlines of the polar polygons. Visible light, particularly at blue wavelengths, also helps define these upper-atmospheric features and can reveal color changes. The northern hexagon, for example, famously shifted from blue to a more golden color as the seasons changed and sunlight produced more haze. These wavelengths provide the crisp shapes we associate with the polar storms.
A Vertically Stacked Puzzle
By combining these multi-wavelength views, scientists have confirmed that these polygons are not flat patterns painted on the clouds. They are immense, vertically stacked structures that extend deep into the atmosphere. In fact, the apparent location of the new decagon can shift slightly depending on the wavelength used to view it. That’s because each wavelength is probing a different altitude of the same colossal atmospheric wave. What might look like a sharp corner in one layer could be a softer curve in another. Understanding how these layers connect is key to solving the mystery of how and why these strange, geometric storms form on Saturn and nowhere else in our solar system.