






What On-Time Performance Actually Measures
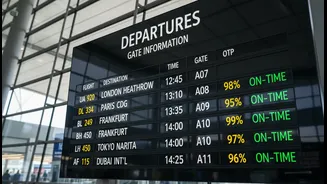
In the aviation industry, a flight is considered 'on-time' if it arrives at or departs from the gate within 15 minutes of its scheduled time. This is the standard benchmark used by regulators and aviation analytics firms globally to rank and compare airlines
and airports. For airlines, the key metric is on-time arrival, while for airports, it's on-time departure. This 15-minute window is a long-standing convention, providing a simple, universal yardstick. If your flight lands 14 minutes late, it's officially punctual. If it lands 16 minutes late, it's not. While seemingly straightforward, this definition is the source of much of the data's limitations.
The Illusion of Punctuality
The 15-minute rule creates a buffer that can mask significant issues. A flight can be consistently late by 14 minutes and still contribute to a near-perfect OTP score. More importantly, this metric completely ignores cancelled flights in some calculations, which are a major disruption for travellers. An airline could theoretically cancel its most-delayed flights to improve its OTP rating, leaving passengers stranded but keeping its statistics clean. Furthermore, the definition of 'arrival' can be manipulated. Some carriers might measure it at runway touchdown rather than at the gate, ignoring long taxi times that keep passengers stuck on the tarmac. This focus on a single, narrowly defined event at the gate means the data doesn't reflect the true passenger journey.
The Passenger Experience Gap
The fundamental problem with traditional OTP is that it's flight-centric, not passenger-centric. It tells you nothing about the human side of the delay. Did you have to wait an extra hour in the terminal before boarding even began? Did your 20-minute delay cause you to miss a connecting flight, turning a minor inconvenience into a day-long ordeal? Research has shown that official flight delay stats are a poor proxy for actual passenger trip delays, which can be significantly longer. Studies on missed connections reveal the scale of the problem; one analysis found that an average delay could cause a missed connection in over 70% of itineraries from smaller airports. These are the data points that truly define a travel experience, yet they are absent from standard OTP reports.
Ripple Effects and System Brittleness
A single delay doesn't happen in a vacuum. The aviation system is a tightly wound network where one late-arriving aircraft can set off a chain reaction. This 'delay propagation' means the plane you're waiting for might be late because its previous flight was delayed, affecting crew schedules and all subsequent flights that aircraft is supposed to make that day. Analysts are now proposing new metrics to measure this, such as a 'Schedule Brittleness Index'. This index would track how likely a schedule is to fall apart after an initial disruption, providing a much deeper insight into an airline's operational resilience than a simple OTP percentage. The data shows that for some airlines, over 97% of initial disruptions cascade into further problems, revealing a system constantly on the edge of chaos.
New Metrics for a New Era of Travel
To get a truer picture, experts and data firms are developing more holistic, passenger-focused metrics. The goal is to move beyond a simple gate-to-gate measurement and evaluate the entire door-to-door journey. This involves integrating data on everything from security wait times to the likelihood of a missed connection. Some new indices quantify delays into an intuitive score reflecting overall disruption levels, rather than a simple binary 'on-time' or 'late' designation. Concepts like a 'Flight Happiness Index' are also being explored. By combining official flight data with information on connection times, cancellation impacts, and delay propagation, the industry can create a measurement that reflects what travellers actually experience, not just what a stopwatch at the gate says.