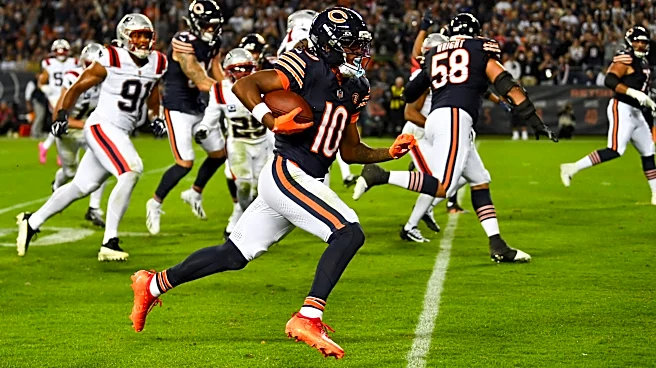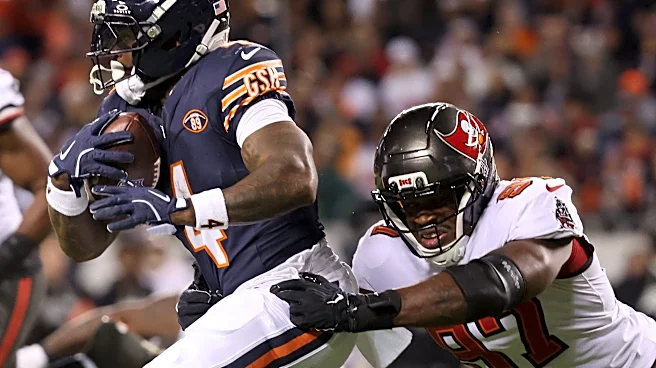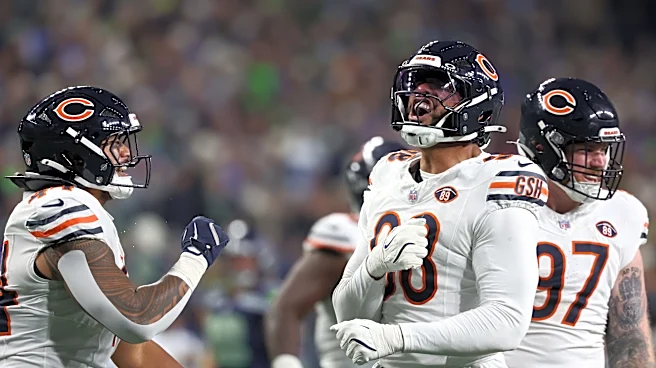


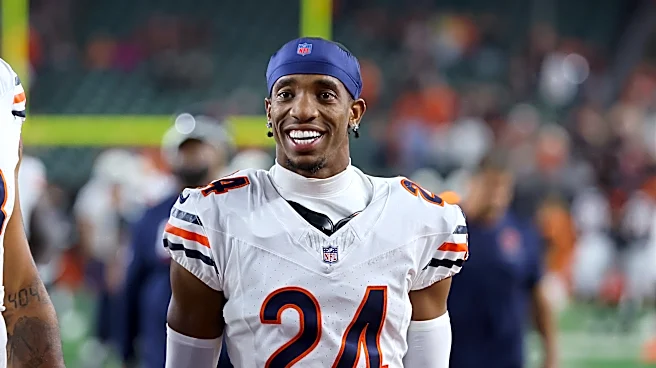
Ahead of the 2026 season, the Chicago Bears defense was considered to be the weakest unit of the roster's three phases. It was viewed as a group short on impact talent up front and depth in the secondary, leaving some concern as to whether they'd be able to compliment an offense that was expected to be among the league's best.
Some of that has come to fruition. Some of it hasn't. Some of it has been aided by the absolutely massive addition of defensive tackle Jeffery Simmons ahead of the trade deadline. From a broad perspective, though, this is a unit that has fared much better than might have been expected just a few months ago.
It's a bit paradoxical. The Bears rank 15th in the league in total yards allowed (2,798) and a paltry 30th in yards allowed per
play (5.9). On a per game basis, though, they're ninth in the league in points allowed (20.4) and yards allowed (310.9). That they've only been on the field for 471 plays speaks to the idea that some of this is heavily skewed by smaller samples and more isolated instances. Only 33 percent of opposing drives have ended in a score, which is seventh-best in the league. They're also still generating turnovers (13 thus far) and have allowed an opposing EPA per play of -0.05. It's an objectively good unit.
While the broader picture — and overall lack of volume wrought by the offense's production — is clouded, advanced stats can at least help us glean something more out of which phases are succeeding at the midway point and which have room for improvement. Let's talk about each one.
Defensive Line
As far as defensive linemen go, the analytics are pretty black-and-white. Did they create pressure? Did they convert that pressure into sacks? In the case of the Bears, both answers are yes. They're tied for fourth in pressure rate as a team (27.0 percent) and seventh in hurry rate (10.3 percent).
The Bears have four defensive linemen inside the top 35 in pressure rate created: Dayo Odeyingbo (15.6 percent), Montez Sweat (10.4), Jeffery Simmons (10.2), and Grady Jarrett (9.9). Obviously Simmons' figure reflects the full season, but he hasn't done anything through two games to dispel the notion that he'll offer the same level of production in the middle of the line that he did in Tennessee. Simmons (10) and Austin Booker (7) each rank inside that group in quick pressures.
Sack rate makes things look even more impressive. Odeyingbo ranks second in the league in this category (3.3 percent), with Booker in seventh (2.3), Simmons checking in in ninth (2.0), and Sweat in 12th (1.8). From an individual standpoint, they've been able to convert the pass rush and subsequent pressure into production on the stat sheet. Their 26 sacks currently sit fourth in the league.
Overall, the unit is doing its job. While the total sack number and cumulative pressure rate aren't completely to their own credit, the unit has held together nicely and we've seen individual impact laid down from players that needed to outperform what may have been expected of them (like Booker or Odeyingbo).
Linebackers
When it comes to what gets laid down on the stat sheet, linebackers are as difficult a position to navigate as there is. They have dual responsibilities versus the run and pass in a way that many of their peers do not, with some of them serving specialized roles within that framework. When injuries force you to rotate players at the position, that complexity grows.
In the case of the Bears, there is at least one clear-cut case to examine in Devin Bush. He's been healthy and he's been quite good, leading the team in tackles (53), stops (31), and pass rushes among non-linemen. He's managed a 23.5 percent pressure rate when blitzing and has a pair of sacks to his name. In coverage, he's allowing an 88.9 passer rating and a catch rate of only 65.4 percent. His EPA allowed in coverage is -9.3, which is seventh-best among qualifying backers.
T.J. Edwards hasn't had quite that kind of year (in performance or in health), but he's been respectable in the eyes of the analytics, too. His passer rating allowed (69.7) is a better mark than it was last season with a -3.2 EPA allowed in coverage. He hasn't made the impact on the blitz (even at his modest 13.2 percent rate) in terms of sack volume, but he's at least created pressure at an 18.5 percent clip that reads slightly higher than last year's.
Outside of the two primary names at the position, D'Marco Jackson has thrown a couple of interest things onto his line. He's created a pair of pressures and has allowed a catch rate of just 44.4 percent (albeit on just nine targets). His -5.9 coverage EPA trails only Bush, even within a smaller sample.
Secondary
This is where things get a little bit dicey. The Bears have visibly struggled in coverage to compensate for injury (whether active or lingering) and underperformance from a number of different performers. The Bears are 21st in the league in yards allowed and rank in the bottom 10 in air yards allowed on completions.
Jaylon Johnson has been the poster boy for these types of struggles, with little surprise coming as a result of his +0.4 EPA allowed in coverage or his +3.0 catch rate allowed over expected. His opposing quarterback rating when targeted is 97.2. He also hasn't been particularly active in getting to the ball. Ball Hawk Rate, measured as Hawk%, charts the rate of times the defender makes a play on the ball when they're the nearest defender. Johnson's 7.5 percent rate is second-worst among qualifying Bears defensive backs.
Tyrique Stevenson has also been a source of struggle in the secondary. In many ways, that's manifested in any even more severe way than that of Johnson. His opposing quarterback rate allowed when targeted is over 134 while his opposing EPA allowed when targeted is an unsightly +15.3. While he's forcing tight windows at a rate higher than any of his fellow defensive backs (25.7 percent), he hasn't been able to capitalize on them even a little bit.
There are, at least, positives that have emerged from this position group. Each of Malik Muhammad (-6.8), Dillon Thieneman (-4.7), and Kyler Gordon (-3.5) have allowed a negative catch rate over expected while each of the two rookies have held opposing receivers to an actual catch rate of 56.0 percent or lower. Thieneman also has a -3.5 EPA allowed to his credit. Gordon & Muhammad, though, do have positive EPA figures against while also allowing the highest rate of yards after catch per reception among secondary defenders.
What's unique about this group is also how Dennis Allen utilizes them. Gordon, in particular, has been able to create pressure on the blitz 40 percent of the time (20 rushes) while each of Thieneman and Muhammad have sacks on their record. Thieneman's 23 stops also trail only Devin Bush. While that was something borne out of necessity prior to Simmons' arrival, it does at least help to recoup some of the value lost by their struggles elsewhere. Ultimately, though, this phase is the one the stands to improve the most in the second half of the year.
Follow Bears Wire on Twitter, Facebook and Instagram
This article originally appeared on Bears Wire: A midseason breakdown of Bears' defensive metrics