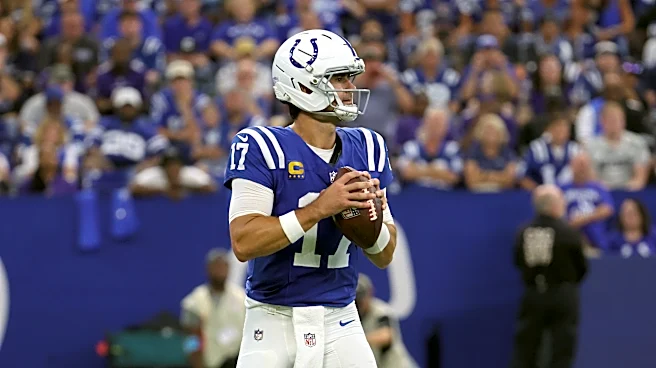



Up next for the Indianapolis Colts is a Week 2 Sunday Night matchup with the Kansas City Chiefs.
So, heading into this contest, which team has the advantage, and where?
When looking at this week's matchup, as we know, the game is not played on paper. However, where these two teams rank in key statistical areas could provide us with some valuable insight into where the Colts may have the upper hand in this game and also where they may not.
It's also important to keep in mind early on in a season that these numbers can be skewed to a degree, given the small sample size.
With so much information out there nowadays, I did my best to boil this article down to the need-to-know statistics for this matchup that do still carry a lot of weight.
With help from
Team Rankings and Pro Football Reference, here is how the Colts match up stat-wise with the Chiefs.
Indianapolis Colts
- Points per game: 23.0 (T18)
- Points per game allowed: 41.0 (31st)
- Yards per rush: 5.1 (7th)
- Yards per rush allowed: 5.5 (28th)
- Yards per pass attempt: 5.4 (26th)
- Yards per pass attempt allowed: 12.2 (32nd)
- Pressure rate on QB: 23.3% (16th)
- Pressure rate allowed on QB: 19.3% (9th)
- Turnover differential: -1 (T20)
- Third down conversion rate: 30% (22nd)
- Defensive third-down conversion rate allowed: 33.3% (13th)
- Red zone success rate: 100% (T1)
- Defensive red zone success rate: 75% (T18)
Kansas City Chiefs
- Points per game: 31.0 (T8)
- Points per game allowed: 10.0 (T2)
- Yards per rush: 5.8 (3rd)
- Yards per rush allowed: 4.1 (16th)
- Yards per pass attempt: 6.8 (19th)
- Yards per pass attempt allowed: 4.1 (2nd)
- Pressure rate on QB: 23.6% (13th)
- Pressure rate allowed on QB: 24.4% (23rd)
- Turnover differential: +1 (T8)
- Third-down conversion rate: 52.9% (7th)
- Defensive third-down conversion rate allowed: 16.7% (T2)
- Red zone success rate: 60% (19th)
- Defensive red zone success rate: 50% (T9)
This article originally appeared on Colts Wire: Colts vs. Chiefs: Who has Week 2 advantage?