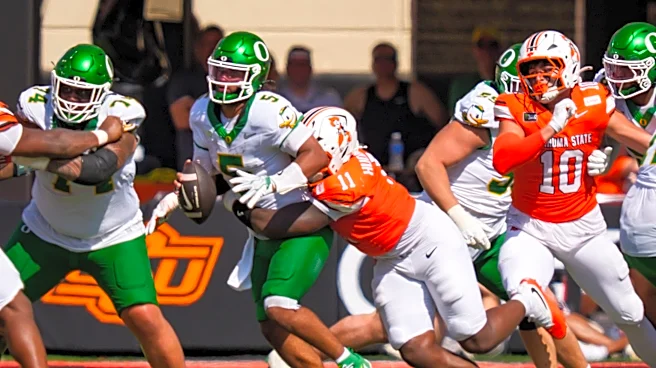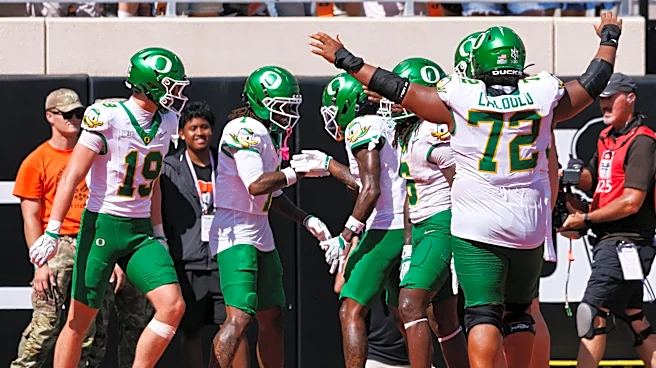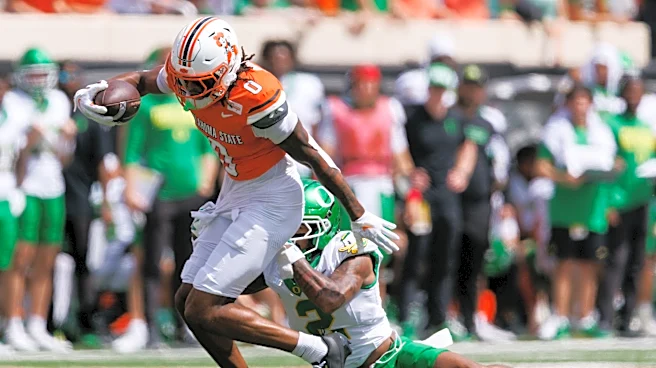







The Oregon Ducks allowing 27 points to the Boise State Broncos in Week 1 could've been waved away as first game rust. But after giving up 554 total yards and 39 points in Week 2 to the Oklahoma State Cowboys, it's time to sound the alarms.
From the opening snap, a 75-yard rush from Oklahoma State quarterback Drew Mestemaker, to the fourth quarter, in which the Cowboys scored nine unanswered points to put away the game, Oregon's defense was downright atrocious. They made some plays early in tipping passes that led to Ducks points, but beyond that there was simply too much open space that Oklahoma State exploited.
Pass defense wasn't good enough. Rush defense wasn't good enough. The only positive is that the special teams unit didn't have any major
blemishes, with a long field goal and several long punts occurring. But aside from that, not much else went well Oregon.
Having put forth a rather terrible performance defensively, the stats reflected that sentiment. Let's check out where the Ducks' defense and special teams stats rank nationally in various stat categories.
Scoring Defense: No. 123

Points allowed per game: 33.0
Passing Defense: No. 111

Pass yards allowed per game: 249.0
Rushing Defense: No. 107

Rush yards allowed per game: 165.0
Total Defense: No. 117

Total yards allowed per game: 414.0
Third Down Defense: No. 35

Third down conversion percentage: 28.1%
Red Zone Defense: No. 85

Red zone conversion percentage: 91.67%
Sacks: No. 80

Total sacks: 3
Tackles for Loss: No. 121

Total tackles for loss: 6
Turnovers Forced: No. 75

Total turnovers forced: 2
Punt Return Defense: No. 20

Average yards per opposing punt return: 2.0
Kickoff Returns: No. 51

Average kickoff return yards: 21.0
Punt Returns: No. 118

Average punt return yards: 1.0
Contact/Follow@Ducks_Wire on X (formerly Twitter) and like our page onFacebook to follow ongoing coverage of Oregon Ducks news, notes, and opinions.
This article originally appeared on Ducks Wire: Where Oregon's defense, special teams rank statistically after Week 2