


Twelve games into the 2025-26 season, the Washington Wizards are — as expected, as planned — one of the very worst teams in the NBA. They’re tied with the Brooklyn Nets (also bad by design) and the Indiana Pacers (pummeled by injuries) with identical 1-11 records, and only the Pacers have a worse strength of schedule adjusted scoring margin.
What makes the Wizards worth watching, even as they get thumped nightly, is their effort, desire to compete, and youth. Also, Alex Sarr. I’ll come back to him.

I keep hearing announcers say the Wizards are the NBA’s “second youngest team.” I’m sure this stat nugget is produced by doing something like averaging the ages of the players on the roster. This doesn’t make a lot of sense — having an old guy or two who doesn’t play sitting on the bench doesn’t say much of anything about a team’s age. What matters is their functional age, which is to ask who’s actually getting minutes.
Using minutes-weighted age, the Wizards are the league’s youngest team. Their rotation so far this season has the lowest average age, just squeaking in ahead of the Charlotte Hornets.
That youth holds some promise for the future. In theory, the young guys will improve and the older guys replaced with younger, better players. In the present, it’s painful. Mostly.
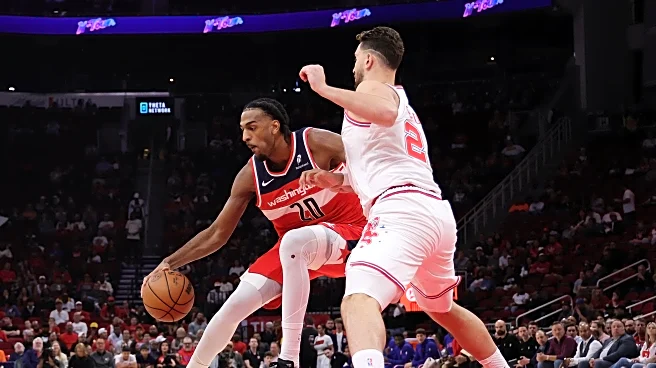
One thing Wizards fans should be enjoying is the performance of Alex Sarr. The 20-year-old big man struggled at times last season but was still pretty good for a teenaged rookie. In the work I’ve done analyzing career trajectories, year two for a teen rookie tends to be one of relatively modest growth. The Leap typically comes in years three and four.
Through 12 games, Sarr is ahead of schedule.
His offensive rating (points produced per 100 individual possessions) was more than 16 points per 100 possessions below average last season. This year, he’s closed the gap to just 1.2 points below average while boosting his usage rate from 22.8% to 26.9%. In other words, he’s carrying a heavier offensive load, and he’s doing it pretty well.
Even better, he’s improved across the board. He’s playing inside more — he’s taking (and making) more twos while taking more threes (but shooting a better percentage. His free throw attempts are up, and his free throw accuracy has gotten better too.
Offensive and defensive rebounding? Up. Same for his assists, blocks, and scoring. He’s fouling less and his defensive impact has improved. He is committing more turnovers, but his turnover rate hasn’t gone up as much as his assists.
I’m not praising him for tripping over a low bar. He’s become actually good — PPA: 161, which is around All-Star level production. Will he get there this season? Probably not. Players from winning teams usually get that honor. But if he keeps playing this well, he’ll deserve consideration — and the wins will come if the front office can assemble a decent roster around him.
What’s fun is that he still has lots of room to improve — strength, touch around the basket, free throw shooting, drawing fouls, reducing turnovers, three-point shooting, positional defense (vs. chasing blocks), to name a few.
The Measuring Stick
The Wizards are the league’s youngest team, and they do a lot of the stereotypically young stuff — namely play fast and make lots of mistakes. They’re fourth in pace, and on a per-possession basis, the Wizards commit the sixth most turnovers, the ninth most fouls, allow the most opponent offensive rebounds, and are at or near the bottom in every meaningful statistical category.
Here’s where they rank in those meaningful statistical measures:
- Offensive Rating (points scored per 100 possessions): 28
- Defensive Rating (points allowed per 100 possessions): 29
And, there ranks in the four factors that determine who wins and loses in basketball:
Offensive Four Factors
- eFG%: 22
- Offensive Rebounding Percentage: 22
- Turnover Rate: 27
- Free Throws Made/Field Goal Attempts: 28
Defensive Four Factors
- eFG%: 20
- Defensive Rebounding Percentage: 29
- Turnover Rate: 30
- Free Throws Made/Field Goal Attempts: 17
What does this tell us? The Wizards don’t shoot well or get many offensive rebounds. They also commit a lot of turnovers and don’t get to the free throw line. On defense, they’re not far from average at making the other team miss — by far the most important defensive factor — and they do a reasonable job of not putting opponents on the free throw line, but they don’t force turnovers or do the job on the defensive glass.
Opponents get the shots they want with little risk of Washington forcing them into turnovers. Making those shots is kinda irrelevant because they can collect the miss and try again.
PPA and Other Metrics
Below is a table with a first look at results from Player Production Average (PPA) metric so far this season. Player Production Average (PPA) is an overall rating metric I developed that credits players for things they do that help a team win (scoring, rebounding, play-making, defending) and debits them for things that hurt the cause (missed shots, turnovers, fouls, ineffective defense). PPA is similar to other linear weight rating metrics such as John Hollinger’s PER, David Berri’s Wins Produced, Kevin Pelton’s VORP, and the granddaddy of them all, Dave Heeren’s TENDEX.
PPA weighs a player’s performance per possession against that of his competitors season by season. While PPA falls into the category of a linear weight metric, the values for statistical categories float a bit season-to-season based on league performance.
PPA is pace neutral, accounts for defense, and includes a “degree of difficulty” factor based on the level of competition a player faces while on the floor. Beginning with the 2019-20 season, I added a position/role adjustment designed to reflect how roles and on-court positioning affect individual abilities to produce certain stats.
Inputs include:
- on-court team defensive rating
- points
- rebounds (offensive and defensive weighed differently)
- assists
- steals
- blocks
- shot attempts
- turnovers
- personal fouls
- starts
- minutes
In the table below, I’m also including games, minutes per game, usage rate and offensive rating.