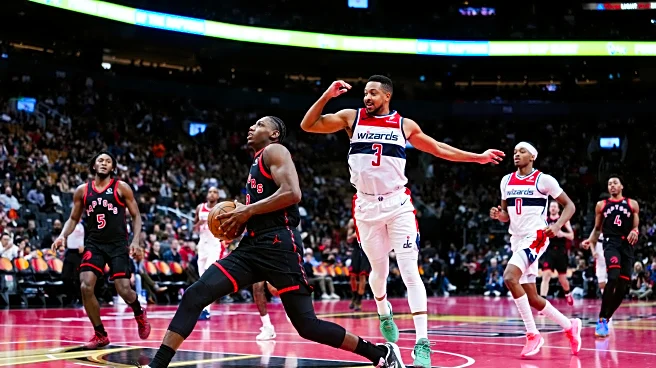
Another NBA Cup game, another 30-point loss for the Washington Wizards. This one was at the hands of the Toronto Raptors, who became the first team this season to secure a spot in the Cup’s knockout round.
With the loss, the Wizards extended two streaks — their tenth consecutive Cup defeat (across three seasons), and their 13th straight loss this season. The Wizards are the only team without a Cup win. They also have the worst scoring differential, which has now ballooned to -142.

This game was so laughably bad, the Raptors scored 48 points in the third third quarter, which was one more point than the Wizards managed in the entire first half.
Toronto won each of Dean Oliver’s Four Factors (table below) — they outshot Washington from the floor, committed fewer turnovers, grabbed more offensive boards, and made more trips to the free throw line. They also won the unofficial battle of “fewest times just losing the ball while trying to dribble” and “bouncing the ball off your own foot.”
Hey, at least the Wizards didn’t allow 20+ offensive rebounds again. The Raptors could manage “only” 13, though this was partly because they so seldom missed — their effective field goal percentage was a lofty 65.5%.
At this point, the Wizards are so badly overmatched each game that I’m getting concerned of creeping nihilism. In some theoretical way, this group maybe — maybe — could play a little better. So…then they lose by 24 instead of 30?
Obviously, the inadequacy of the roster is by design. They’ve decided that losing and getting high draft picks is the best path to future success. And they (meaning Ted Leonsis, Michael Winger, Travis Schlenk, and Will Dawkins) might be right. But lordy is it painful to watch.
Thoughts & Observations
- I think Brian Keefe is a good coach. Or might be with a better roster. I’m hoping he can keep guys engaged and focused on playing for each other long enough to be part of the eventual turnaround. That said, I expect he’ll be the first casualty of the extended losing.
- Corey Kispert had a decent offensive game. On defense, he was repeatedly — and successfully — attacked by the Raptors.
- Bub Carrington’s utter lack of defensive presence or effectiveness is a real problem.
- Cam Whitmore had a couple nice moments on offense. The only play that stood out on defense was when the Wizards went zone, he didn’t understand that he had the center role, and then once he got into it, let Sandro Mamukelashvili stroll past him to be wide open under the rim. Keefe was so befuddled and infuriated, he looked like he was having a seizure.
- CJ McCollum scored 20 points in 26 minutes. yay.
- Tre Johnson hit a couple threes and wasn’t bad on offense.
- Jamir Watkins made a three. (I’m trying to be positive here.)
- With a below replacement level 40, Bilal Coulibaly had the second highest PPA score for a Wizards starter last night. High score for a starter (110) went to McCollum.
Four Factors
Below are the four factors that decide wins and losses in basketball — shooting (efg), rebounding (offensive rebounds), ball handling (turnovers), fouling (free throws made).
The four factors are measured by:
- eFG% (effective field goal percentage, which accounts for the three-point shot)
- OREB% (offensive rebound percentage)
- TOV% (turnover percentage — turnovers divided by possessions)
- FTM/FGA (free throws made divided by field goal attempts)
Stats & Metrics
PPA is my overall production metric, which credits players for things they do that help a team win (scoring, rebounding, playmaking, defending) and dings them for things that hurt (missed shots, turnovers, bad defense, fouls).
PPA is a per possession metric designed for larger data sets. In small sample sizes, the numbers can get weird. In PPA, 100 is average, higher is better and replacement level is 45. For a single game, replacement level isn’t much use, and I reiterate the caution about small samples sometimes producing weird results.
POSS is the number of possessions each player was on the floor in this game.
ORTG = offensive rating, which is points produced per individual possessions x 100. League average so far this season is 115.1. Points produced is not the same as points scored. It includes the value of assists and offensive rebounds, as well as sharing credit when receiving an assist.
USG = offensive usage rate. Average is 20%.
ORTG and USG are versions of stats created by former Wizards assistant coach Dean Oliver and modified by me. ORTG is an efficiency measure that accounts for the value of shooting, offensive rebounds, assists and turnovers. USG includes shooting from the floor and free throw line, offensive rebounds, assists and turnovers.
+PTS = “Plus Points” is a measure of the points gained or lost by each player based on their efficiency in this game compared to league average efficiency on the same number of possessions. A player with an offensive rating (points produced per possession x 100) of 100 who uses 20 possessions would produce 20 points. If the league average efficiency is 114, the league — on average — would produced 22.8 points in the same 20 possessions. So, the player in this hypothetical would have a +PTS score of -2.8.
Players are sorted by total production in the game.


