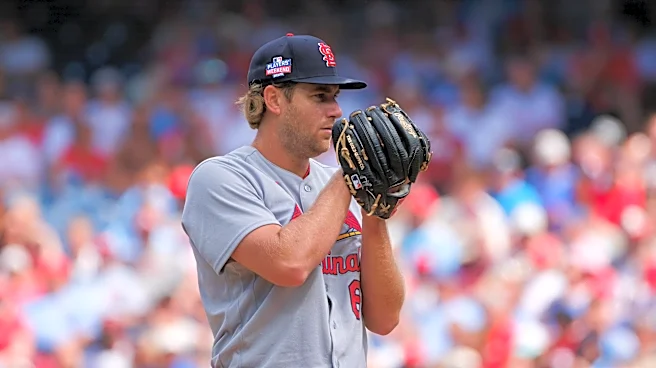

When I learned late last year that the Cardinals intended to make Kyle Leahy a starter, my first impression was….hmmm. I sifted some data on his past as an MiLB starter and was profoundly unimpressed. His starting history, last at AA, was quite similar to many young pitchers who never see a major league mound. Not promising. Yet, we had some more recent data where he was experiencing a fair amount of success as kind of a jack-of-all-trades reliever. Enough that I wasn’t sure what bucket to put him
in. Swingman? Multi-inning relief? Leverage reliever? In 2024, he showed some promise. In 2025, he handled all the roles thrown at him adroitly, confounding the predictive stats that preceded him. His 88 IP of relief defied orthodoxy that would suggest overload, and yet he closed the year with a starting assignment! My (first) impression was that he was one of those guys who might be more than a reliever but perhaps less than a full-on regular starter. A tweener in the mold of Colin Rea or Chad Patrick. I wondered if the decision to move him to starter was motivated more by lack of starting depth than it was a real attempt to better leverage his pitching acumen. Like many things, I was willing to see how it turned out, and I put this date in my calendar of articles to write, and I would come back and re-assess. So, here we are.
We now have almost two years of data on Mr. Leahy. Albeit somewhat mixed because of his changing roles, but we are moving beyond small sample size. Starting with some raw counting stats showing what he has accomplished as a starter in 2026, I see he has accumulated 2.4 fWAR through the end of August. That places him 40th among MLB starters, almost in a dead heat with our own Andre Pallante. Some folks would describe this performance as a solid#2. I’m not sure I’d go that far. I look at good rotations (SEA, NYY, PHI) and see that they have multiple starters operating above this level, in some cases a fair bit above (5 pitchers have more than doubled Leahy’s 2.4 fWAR). In reality, in a strong rotation, Leahy’s performance would be 3rd or 4th best. That is nothing to sneeze at. So, overall, he has been pretty good.
Breaking his performance down by month, there are some striking numbers:
When I look at any pitcher, these columns are my go-to, first look indicators. My very first? 3.51 overall FIP. I like anything under 4.00, and anything under 3.50 falls in the really, really good category. I was immediately curious about his FIP as compared to xERA and xFIP. I think of FIP as expected ERA based on pitcher controllables. xERA is expected ERA based on context-insensitive batted ball data. Across 3 years of MLB history, Leahy has consistently over-performed his xStats. Some of that is the ballpark he pitches in, some of that is the defense he pitches in front of, and some of that is his innate ability to avoid hard pull contact. It becomes hard to attribute much to good luck, not across 3 years.
What I really notice is that Kyle has improved as the season has gone on, with the inflection point appearing in June. He struggled across the board in April, his predictive stats (FIP) suggested better days in May and by June his actual results started to really improve. Notice how his xERA comes closer to his FIP as the season wears on. Not as much divergence. I note the striking difference in K-BB% from July onward. Something to explore when I mine the pitch-by-pitch data. My personal threshold is I look for a K-BB% of 15 or better. These last two months have been a fair bit better. Sustainable? Interestingly, he has improved both his K% and his BB% as the season has gone on. But that stark change between June and July sure stands out. What gives?
We will get there, but I follow my usual methodology in diving deeper and deeper until I find answers.

To go beyond the stat line, let’s look at some underlying (Statcast) metrics. On the left we see that Leahy has a six pitch assortment, which is it’s own advantage. None of the pitches exhibit extraordinary movement, although that Sweeper sweeps horizontally toward the high end of the average scale, as does the Slider.
These two pitches have plus movement, but I suspect having six pitches he can regularly throw for strikes makes each one of them a little better. First, it is easy for a hitter to eliminate a pitch or sit on one when a 2- or 3- pitch pitcher is having trouble throwing one of his pitches for strikes. Not so easy to do when that pitcher still have 3 more pitches in his arsenal.
Kyle pretty evenly distributes his pitches, also, throwing nothing more than 27% of the time nor less than 13%. His most thrown pitch, like most pitchers, is his FB. 27% is relatively low usage rate, however.

Here on the left, we see some blue (not so hot) and some red (good). Notice that HardHit% in the 2nd percentile. I’m thinking that is a vestige of early season woes. I do notice that FG has his HardHit% at 41% where as Statcast has it at 48%. Why the gap? Are their HardHit calc methods THAT much different?
We will see a chart that shows his rolling average later. HardHit% has steadily declined through the season and is better than average now. In fact, if you look at the table at the top and the chart on the left, you can see evidence that many of the blue lines are lagging his current output. The key question is … is the improvement sustainable, or is the aggregated, full season view more indicative?
On the more positive side, we see that Leahy has a strong GB% and an excellent walk rate. These numbers are in line with his historical norms, such as they are in a relief role.
About that striking change in the June-July timeframe, I got curious, so I went to Fangraphs and graphed out his pitch usage by month and added in hard hit % (shown below). Starting with the HardHit% (the dark blue line), you notice a steady decline as the season goes on, falling below (better than) league average in the June timeframe. I don’t have room for another visual, but I looked and xwOBA follows a very similar trend line. Interestingly, I notice that the downward trend in HardHit% (and xwOBA) follow a similar trajectory to declining reliance on his fastball (the purple line below). Instead, he has added more use of his breaking/off-speed pitches (ie. added more wrinkle to his game) as shown in the red, yellow and blue lines.

The pitch mix influence on HardHit% and xwOBA seems to be correlated. Cause and effect? Let’s continue.
If we look at Stuff+, Leahy’s FB is rated at 93 this year, or below average. That explains why it is getting hit hard and why he is using it less. His Sinker (115) and his Slider (111) Stuff+ ratings are excellent although his Curve (95) and Cutter (93) ratings are below average. I would note that he carries a strong Location+ rating of 105 (overall) and in the aggregate Pitching+ has him as a slightly above average pitcher in 2026 as well as across his career.

Here are some more things to peek at. The chart on the left essentially demonstrates how well Leahy tunnels his various pitches. When a pitcher “tunnels” well, he makes it harder for the hitter to discern spin well enough read what the pitch is going to be by making some or all them appear to spin the same. In this case, Leahy releases his 4-seam and 2-seam (Sinker) fastballs with nearly the same spin direction, but as you can see in the above chart, different movement. I’d personally like to see more differentiation there, but that is nitpicking.
The Sinker has above average rise, but in ways ends up being too much like his four seamer, although independently, the Sinker performs better. Likewise, he tunnels his Change well with the two fastballs, but gets pretty ordinary results, mostly as a result of sub-optimal pitch shape. His change simply doesn’t have enough fade at the end to fool a hitter and the velo difference itself isn’t enough. Notice on the opposite side of the spin cycle sit the sweeper and curveballs. The exact opposite spin on a pitch looks the same to a hitter with sharp eyes (ie. that’s also good tunneling). Guess what? Those pitches, while the spin looks the same out of his hand, the pitches behave radically differently when the get to the plate and they become highly effective. In the end, Sinker-Sweeper-Curve combinations are his bread and butter and show each having positive run value that leans elite. Oddly, his slider is not well disguised, but is still quite effective.
In the end, you have a pitcher with three pretty effective breaking balls (Sweeper, Curve, Slider) and a reasonably good 2-seam Fastball (Sinker). After looking at this, I am a bit surprised about the following:
Here I mapped out the same stats as above, but instead of by month, I did by times through the order. Even with a pretty effective four pitch mix, Leahy is largely unable to successfully navigate an order for the third time (beware of SSS – only 19 IP pitched 3rd time through). I suspect some of it has to do with stamina (not being used to a starter’s work load) and perhaps a little bit to do with needing to show more of his breaking pitches early (due to a non-productive fastball) and just flat giving hitters too many looks at them by the third time through. That sinker spin has enough difference that once hitters get some looks, they will pick it up and that will allow them to either sit on it or ignore it, both of which reduce the effectiveness of having a deep arsenal (as it is no longer deep). Time will tell on this one. The fall off in K-BB% the third time through is striking, no?
One last thing I look at…run values for his pitches. This ends up being a little redundant, but there are some interesting tidbits when each pitch is summarized into one value. Why is the 4-seam having so much less run value this year than last? His velo is down more than 1 mph (probably typical in the transition from reliever to starter). Why is his good curveball not quite as good this year? I don’t know. This where comparing Kyle Leahy the reliever with Kyle Leahy the starter becomes challenging. So I note, and wait for more data.

Some questions going forward
So, do we know why his K-BB% has improved so dramatically recently? Is it the refined pitch mix? Will the league catch up to that?
How will his body and his arm react next year after setting new highs in IP and overall workload (pitches, up/downs, steps, etc.)?
Which pitcher is he? The April/May Leahy or the July/August Leahy? Is June the 50th percentile outcome for him? Have we seen floor and ceiling together this season?
Summary
My primary concern with Kyle is his IP and what it will be by season’s end. Pitchers who greatly exceed their prior workloads have a pretty strong tendency to be not as sharp in the following season and subject to greater incidence of injury.
As a pitcher, he seems solid, if unspectacular. His pitch mix, GB% and low walk rate seem like sustainable, steady-eddy results that will likely keep him from being super-volatile, either up or down. I really like how he has improved as this season goes on, and I think it is fair to say he has built on his successful 2025 season very well.
I wonder if we’d like him a lot more if he was doing this at age 24 or 25, than at age 29?